(英文)
Results and discussion
Mathematical model and simulation
Diploid cells have pairs of homologous chromosomes, and genes are expressed from the paternal and maternal chromosomes at roughly the same frequency, except in the case of imprinted genes and for genes on sex chromosomes (DeVeale et al. 2012; Lagarrigue et al. 2013). The frequency of expression of a sequence from a parent is expected by chance to follow a binomial distribution. Because bias caused by PCR amplification can affect this distribution, the influence of PCR bias was examined. When we consider nonimprinting genes having heterozygous SNPs, the allele frequency is expected to be approximately 50% for samples that consist of only one cell type, and the unbalanced representation of certain SNPs caused by contamination should appear as a shift in the distribution peaks.
結果と検討
数理モデルとシミュレーション
二倍体細胞は相同染色体のペアを持っています。遺伝子は、インプリント遺伝子の場合と性染色体上の遺伝子を除き、父方と母方の染色体からおよそ同一の頻度で提供されている(DeVeale et al. 2012; Lagarrigue et al. 2013)。片親からの配列の発現頻度は、二項分布に従う見込みによって期待されている。 PCR増幅に起因するバイアスがこの分布に影響を与える可能性があるため、PCRバイアスの影響を調べた。ヘテロ接合のSNPを有するノンインプリンティング遺伝子を考える際、対立遺伝子頻度は、ひとつの細胞型で構成されたサンプルの約50%であると予測され、かつ汚染によって引き起こされた特定のSNPのアンバランスな表現は分布ピークのシフトとして表われてくるはずです。
(英文)
A simulation was carried out to illustrate how contaminating cells affect the simple binomial distribution of allele frequencies. When the number of the reference allele (A) is nA and that of the alternative allele (a) is na, the chance of detection of the reference allele is nA/(nA + na). In RNA-seq experiments, bias originating from PCR should be considered. To simplify the model, the PCR bias was incorporated by assuming that the sequences containing A and a were amplified 2α and 2β times, respectively. If we obtain N fragments of the locus with RNA-seq, the probability of k reference allele sequences is calculated as follows:
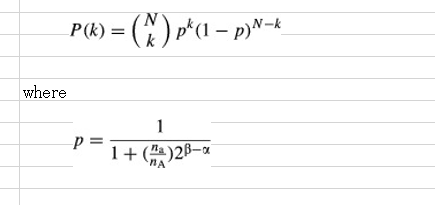
混入細胞が対立遺伝子頻度の単純な二項分布にどのように影響するかを図示するためにシミュレーションが実施された。参照対立遺伝子(A)の数をnA、代替対立遺伝子(a)のそれをnaとするとき、参照対立遺伝子の検出の可能性はnA /(nA+ na)である。 RNA-seqの実験では、PCRから生じるバイアスを考慮しなければならない。モデルを単純化するために、PCRバイアスはA及びaを含む配列がそれぞれ、2のα乗と2のβ乗倍に増幅されたと仮定して組み込まれた。もし我々がRNA-seqの持つ遺伝子座のN断片を得た場合は、k個の参照対立遺伝子配列の確率は次のように計算される。
(続き)
The simulation in Fig. 1A was carried out using conditions where N = 50 and β - α followed a Gaussian distribution, having standard deviation of 0 (no PCR bias) or 1 (high PCR bias). The simulation indicated that the variance of the distribution was highly dependent on PCR bias and that the mode of the distribution corresponded to the composition of SNP alleles. Allele frequencies of several sets of RNA-seq data from various cell types obtained from public databases were examined, and the results agreed with the simulation (Fig. 1B). Peaks at 0 and 100% might result from the homozygous SNPs in observed cells. An artificial contaminating situation was also generated with random sampling of RNA-seq datasets from two cell categories, pure C57BL/6 (B6) hematopoietic stem cells (HSCs), and a mixture of 129 and B6 embryonic stem cells (129B6F1 ESCs) at various ratios. The curve shape and peak positions varied along the ratio as shown in the mathematical simulation (Fig. 1C, gray line).
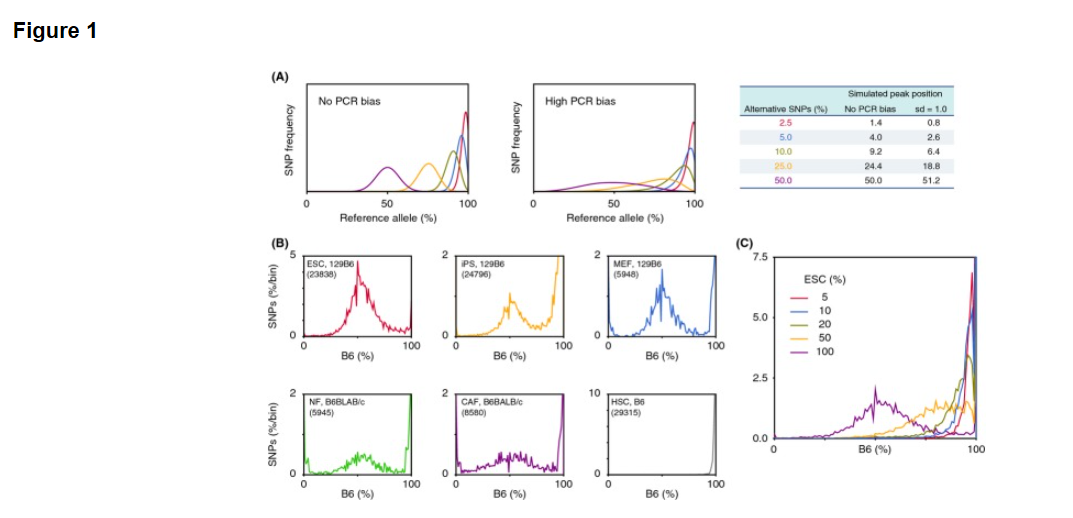
図1AのシミュレーションはN= 50で、かつ標準偏差が0(無PCRバイアス)または1(PCRバイアス)を有する ガウス分布に従ったβ-α条件を用いて行った。シミュレーションは分布の分散がPCRバイアスに依存的であったこと、分布様式が対立遺伝子の組成に対応していることを示した。公開データベースから得られた様々な細胞型からRNA-seqのデータのいくつかのセットの対立遺伝子頻度を調べた結果、シミュレーション(図1B)と一致した。 0%と100%でのピークは観察された細胞内のホモ接合のSNPに起因する可能性があります。人工汚染状況はまた2つのセルのカテゴリからのRNA-seqのデータセットのランダムサンプリングによって作られています。それは純粋なC57BL / 6(B6)の造血幹細胞(HSC)と各種129及びB6胚性幹細胞(129B6F1のESC)の各種比率の混合物の二つです。数学的シミュレーション(図1C、灰色の線)のように曲線形状とピーク位置はその比率に沿って変化しています。
(Fig. 1のリジェンド)
Figure 1. Allele frequency analysis of RNA-seq data. (A) Simulation of SNP allele frequencies using a modified binomial distribution. Peak position was determined by the composition of two alleles, and variance of the distribution was dependent on sd, standard deviation of simulated PCR bias. (B) SNP distributions in several cell types. ESCs (red, SRR1047502, 129B6F1 background), iPSs derived from fibroblasts (yellow, SRR1047504, 129B6F1), MEFs (blue, SRR104220, 129B6F1), normal fibroblasts (NFs; green, SRR1191170, B6 x BALB/c), cancer-associated fibroblasts (CAFs; purple, SRR1191171, B6 x BALB/c), and HSCs (gray, SRR892995, B6). The number of applied SNPs for each cell type is shown in parentheses in each box. (C) Allele frequency of HSC samples contaminated with different percentages of ESCs as shown.
[図1] RNA-seqデータの対立遺伝子頻度解析。(A)修正された二項分布を用いたSNPの対立遺伝子頻度のシミュレーション。ピーク位置は、2つの対立遺伝子組成物により決定され、分布の分散はsd、即ちシミュレートされたPCRバイアスの標準偏差に依存している。(B)いくつかの細胞型におけるSNP分布。ESCs<ES細胞>(赤、SRR1047502、129B6F1背景) 、線維芽細胞から誘導されたiPSs<iPS細胞>(黄色、SRR1047504、129B6F1)、MEF<マウス胎児線維芽細胞:フィーダー細胞>(青、SRR104220、129B6F1)、正常な線維芽細胞(NFs;緑、SRR1191170、B6 X BALB/ c )、癌化した線維芽細胞(CAFs;紫、SRR1191171、B6 x BALB / c)及びHSCs<造血幹細胞>(灰色、SRR892995、B6)。各細胞型のために適用されたSNPの数は各ボックス内の括弧内に示されている。 (C)示されたES細胞の異なる割合で汚染された造血幹細胞資料の対立遺伝子頻度。
(本文続き)
Re-analysis of STAP paper: Genotype analysis of fibroblast growth factor-induced stem cells (FI-SCs)
This study examined how SNP allele frequencies in RNA-seq data can be used to show properties of the dataset. Obokata et al. recently reported the phenomenon of STAP, the induced cellular reprogramming of committed somatic cells into pluripotent stem cells that can produce embryonic and placental tissues when injected into blastocysts (Obokata et al. 2014a,b). The allele frequency approach described above was used to examine the NGS dataset provided by the researchers. Allele frequencies between reference allele (equivalent to B6 genotype for dbSNP) and alternative allele (corresponding to 129 genotype in this study) were examined in RNA-seq data from seven replicate experiments obtained using the TruSeq reagent (Figs 2A and S1 in Supporting Information).
STAP論文の再解析: 線維芽細胞増殖因子によって誘導される幹細胞(FI-SC
)の遺伝子型解析
この研究はRNA-seqデータの中のSNP対立遺伝子頻度がいかにしてデータセットのプロパティを表示しうるに至るのかを検討している。 小保方らは最近STAP現象を報告した。それは胚盤胞に注入された場合に胚および胎盤組織を作り出すことができる多能性幹細胞へと変化した体細胞の誘導細胞再プログラミングを意味する(Obokata et al. 2014a,b)。上述の対立遺伝子頻度のアプローチは研究者らによって提供されているNGSデータセットを調べてきたものである。参照対立遺伝子(dbSNPのB6遺伝子型に相当)と、代替の対立遺伝子(この研究では129の遺伝子型に対応する)間の対立遺伝子頻度は、TruSeq試薬を使用して得られた7回の反復実験から得られたRNA-seqデータの中で検討されている(サポート情報の図2AおよびS1) 。
(英文)
The allele distributions of six of the seven experiments showed the equal representation of parental chromosomes expected in Fig. 1A. For the experiments that involved ESCs, STAP cells, and STAP stem cells (STAP-SCs), there were no 0% peaks (Fig. S1 in Supporting Information), possibly because the cells were obtained from mice backcrossed in the laboratory that may have a different genotype than those in the public database.
7回の実験中6回の対立遺伝子分布は図 1Aで期待されている親の染色体と同じ表現を示した。ES細胞、STAP細胞、およびSTAP幹細胞(STAP-SCS)を含む実験では全くの0%のピークは無かったが(サポート情報の図S1)、おそらく細胞が実験室で戻し交配されたため、公開データベース (J. Sharif and K. Isono, personal communication)のものとは異なる遺伝子型のマウスから得られたからであろう。
(Fig. 2のリジェンド)
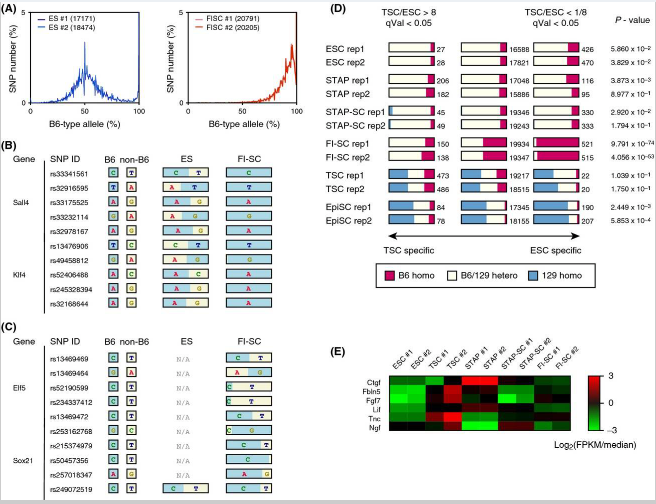
Figure 2. SNPs detected in FI-SC mRNAs indicating contamination. (A) Allele distributions obtained from ESC and FI-SC RNA-seq experiments used in the STAP paper. Both ESCs (blue) and FI-SCs (red) are annotated as having a 129B6F1 genetic background. The number of applied SNPs for each experiment is shown in parentheses in the boxes. (B) SNPs detected in Sall4 and Klf4, which are highly expressed in ESCs. B6-type alleles are shown in blue and 129-type alleles (i.e., non-B6) are in yellow. (C) SNPs detected in the TSC-specific genes Elf5 and Sox21. (D) The number of homozygous/heterozygous SNPs observed in the stem cells used in the original paper. Only the composition observed in FI-SCs would be predicted to affect gene expression. P-values were calculated using Fisher's exact test of genotype distribution between TSC-specific genes and ESC-specific genes. Rep1 and rep2 denote two replicated experiments. (E) Heatmap of representative cytokine and extracellular matrix genes that are highly expressed in MEFs. Normalized log ratios of fragments per kilobase of exon per million reads (FPKM) against the medians of all samples were shown.
[図2] 汚染を示すFI幹細胞のmRNAで検出されたSNP。 (A)STAP論文に使用されたES幹細胞とFI幹細胞のRNA-seqの実験から得られた対立遺伝子分布。ES幹細胞(青)とFI幹細胞(赤)の両方とも129B6F1遺伝子背景を有していると注釈されている。各実験のために適用されたSNPの数は、ボックス内の括弧で示されている。(B)ES幹細胞で高頻度で発現されるSall4及びKlf4で検出されたSNP。 B6型対立遺伝子は青で、129型対立遺伝子(すなわち、非B6)は黄色で示されている。 (C)TS細胞特異遺伝子Elf5及びSox21で検出されたSNP。 (D)元の論文で使用された幹細胞で観察された沢山のホモ接合/ヘテロ接合SNP。 FI肝細胞の中で観察された組成物だけが遺伝子発現に影響を与えると予測される。 P値はTS細胞特異遺伝子およびES細胞特異遺伝子間の遺伝子型分布のフィッシャーの正確確率検定を用いて計算されている。 REP1およびREP2は、2つの反復実験を表す。(E)代表的なサイトカインおよび高頻度で胎児線維芽細胞に発現る細胞外マトリックス遺伝子のヒートマップ。全サンプルの中央値に対する万単位読み取り断片あたりの千単位エクソン断片の正規ログ比(FPKM)が示されている。
(本文続き)
Surprisingly, FI-SCs that were annotated as coming from the F1 129Sv (129) and B6 cell populations did not show the allele distribution pattern of unbiased nonimprinting genes (Fig. S1 in Supporting Information). The distribution was more similar to that of cells with unequal chromosomes. These FI-SCs were reported to be induced from STAP cells with Fgf4 and to have characteristics similar to trophoblast stem cells (TSCs), such as their gene expression profiles and potential to contribute to the placenta (Obokata et al. 2014a).
驚くべきことにF1 129SV(129)とB6の細胞集団由来と注釈されているFI幹細胞はバイアスのないノンインプリンティング遺伝子の対立遺伝子分布パターンを示さなかった(サポート情報の図S1)。分布は不均等な染色体を有する細胞のものにより類似している。これらのFI肝細胞はFGF4<線維芽細胞増殖因子-4 >によったSTAP細胞から誘導され、かつそれらの遺伝子発現の特徴と胎盤に貢献する能力のように、栄養膜細胞(TS細胞)に似た特性を有することが報告されている(Obokata et al. 2014a)。
(英文)
The obvious difference in the FI-SC curve from the 129B6F1 genotype, combined with the fact that the majority of SNPs were similar to B6, suggested that the FI-SCs originated from neonatal mice of a nearly pure B6 background. Further analysis of gene expression patterns suggested that the heterogeneity of SNPs between B6-type allele and non-B6 could be caused by the expression characteristics of genes. As shown in Fig. 2B, SNPs expected to be heterogeneous between 129 (i.e., non-B6) and B6 were examined in several ESC marker genes. ESCs carried alleles from both the 129 and B6 backgrounds at these loci, but the FI-SCs, although described as having the same genetic background as the ESCs (Obokata et al. 2014a), carried only SNPs from B6. This dominance of the B6 genotype was not observed in TSC marker genes (Fig. 2C).
大多数のSNPがB6と似ているという事実と組み合わせると、129B6F1遺伝子型とFI幹細胞曲線の明らかな差異はFI幹細胞がほぼ純粋なB6バックグラウンドの新生仔マウスに由来することを示唆している。遺伝子発現パターンの更なる分析は、B6型対立遺伝子と非B6間のSNPの不均一性が遺伝子発現特性に起因することが示唆されている。図2Bに示めされているように、129(すなわち、非B6)およびB6間で異質であることが期待されているSNPは、いくつかのES細胞マーカー遺伝子の中で調べられている。ES細胞はこの遺伝子座において129とB6の両方のバックグラウンドからの対立遺伝子を持ち込んでいるが、FI幹細胞は、ES細胞と同じ遺伝子背景を持つと書かれているにもかかわらず(Obokata et al. 2014a)、B6からの対立遺伝子しか持ち込んでいない。 B6遺伝子のこの優勢はTS細胞のマーカー遺伝子には観察されなかった(図2C)。
(英文)
The FI-SC specificity was not limited to the genes shown in Fig. 2B and C. When all heterogeneous SNPs were classified into three groups, SNPs in ESC-specific genes, SNPs in TSC-specific genes, and SNPs in other genes, only FI-SCs had widely heterozygous SNPs for these groups (Fig. 2D). If all included cells in a sample share the same cellular features, one would not expect to see this phenomenon of particular gene sets having different genotypes.
FI幹細胞の特異性は図2B及びCに示す遺伝子に限定されなかった。すべての異質SNPが、ES細胞に特異的遺伝子のSNP、TS細胞に特異的遺伝子のSNP、および他の遺伝子のSNPの3つのグループに分類されているとき、FI幹細胞のみがこれらのグループに広くヘテロ接合のSNPを有していた(図2D)。試料中に含まれるセルのすべが同じ細胞の特徴を共有している場合、異なる遺伝子型を有する特定の遺伝子セットのこの現象は見られ得ないであろう。
(英文)
Because the FI-SCs showed a specific genotype at some TSC markers, they may have been contaminated with TSCs. Feeder cells, however, could be another source of contamination, as the FI-SCs were cultured with mouse embryonic fibroblast (MEF) feeder cells whose genotype was not described in the original paper. For this study, the expression of marker genes for MEFs was examined and compared with the expression of ESC and TSC markers, and the results indicated the absence of expression of these MEF genes in FI-SCs (Fig. 2E). The probability of contamination by MEFs is therefore negligible, and the most likely explanation for the skewed distribution of allele frequencies detected in the duplicated RNA-seq experiments is that the FI-SC population originated from two cell types: ESC-like cells having a B6 genetic background and TSC-like cells having a genotype similar to that of CD1, which is a mouse strain other than B6 and 129.
FI幹細胞はいくつかのTS細胞マーカーで特定の遺伝子型を示したので、それらはのTS細胞で混入汚染されている可能性がある。しかしながら、 FI幹細胞がその遺伝子型が元の論文に記載されていないマウス胚性線維芽(MEF)フィーダー細胞とともに培養されていたとしたら、フィーダー細胞も混入汚染の他の原因でありうる。この研究にとって、MEF<マウス胚性線維芽細胞>のためのマーカー遺伝子の発現は調べられており、かつ、ES細胞とTS細胞のマーカー発現と比較されていて、その結果はFI幹細胞の中のこれらのMEF遺伝子の発現の欠如を示している(図2E)。 従ってMEF<胚性線維芽細胞>の混入の可能性は無視でき、かつ、重複RNA-seqの実験で検出された対立遺伝子頻度の傾斜分布の最も可能性の高い説明は、FI幹細胞の集団が次の2つの細胞型に由来していることである:B6遺伝子背景を有するES様細胞と、B6と129以外のマウス株で、CD1と同様の遺伝子型を有するTS様細胞。
- 2019/05/14(火) 10:01:28|
- 遠藤論文
-
-
| コメント:0