(英文)
Quality control method for RNA-seq using single nucleotide polymorphism allele frequency
Takaho A. Endo*
Article first published online: 21 SEP 2014
1. Top of page
2. Abstract
3. Introduction
4. Results and discussion
5. Conclusion
6. Experimental procedures
7. Acknowledgements
8. References
9. Supporting Information
『一塩基多型対立遺伝子頻度を用いたRNA-seqのための品質制御方法』
Takaho A. Endo*
Article first published online: 21 SEP 2014
1.ページ先頭
2.要約
3.導入
4.結果と検討
5.結論
6.実験経過
7.謝辞
8.照会
9.参考
(英文)
Abstract
RNA sequencing (RNA-seq) provides information not only about the level of expression of individual genes but also about genomic sequences of host cells. When we use transcriptome data with whole-genome single nucleotide polymorphism (SNP) variant information, the allele frequency can show the genetic composition of the cell population and/or chromosomal aberrations. Here, I show how SNPs in mRNAs can be used to evaluate RNA-seq experiments by focusing on RNA-seq data based on a recently retracted paper on stimulus-triggered acquisition of pluripotency (STAP) cells. The analysis indicated that different types of cells and chromosomal abnormalities might have been erroneously included in the dataset. This re-evaluation showed that observing allele frequencies could help in assessing the quality of samples during a study and with retrospective evaluation of experimental quality.
<概要>
RNAシークエンシング(RNA-seq)は個別遺伝子の発現レベルに関してのみならず、その細胞のゲノム配列についての情報をも提供する。我々が全ゲノム一塩基多型(SNP)変異体情報のあるメッセンジャーRNAデータを使用する場合、対立遺伝子頻度は細胞集団の遺伝子組成、および/または、染色体異常を示し得る。ここに私はどのようにしてmRNAの中のSNPが最近取り下げられた刺激惹起性多能性獲得(STAP)細胞論文に基づいたRNA-seqデータに焦点を当てることによって、RNA-seqの実験を評価するために使用し得るかという方法を示します。分析は異なった種類の細胞と染色体異常が誤ってデータセットに含まれているかもしれないことを示ました。この再評価は、対立遺伝子頻度の観察が研究中や実験の質の遡及評価をともなうサンプルの品質評価に役立つかもしれないことを示しています。
(英文)
Introduction
In molecular biological experiments, care must always be taken to prevent contamination from external sources, environmental substances, and undesired cells such as cocultured feeder cells. This has become increasingly important, as transcriptome analysis at the level of the single cell is now more common. Detecting contamination is often very difficult before sequencing experiments, and it is only when results are markedly different from predicted findings that researchers may suspect contamination. Various quality control methods have been proposed, but they focus mostly on other technical aspects of experiments (Wang et al. 2012). Here, I describe an approach to detect contaminating cells in studies using next-generation sequencing (NGS), particularly in transcriptome analyses based on RNA-seq techniques.
<導入>
分子生物学的実験では外部ソースや環境物質或いは共培養フィーダー細胞などの望ましくない細胞からの汚染を防ぐように常に注意が払われなければならない。このことは、単一細胞のレベルでのメッセンジャーRNA解析がより一般的となっている現在、ますます重要になっています。シークエンシング実験をせずに汚染を検出するのはしばしば非常に困難であり、また研究者が汚染を疑うのは結果が予期された発見と著しく異なった場合のみである。さまざまな品質管理手法が提案されているが、彼らは(Wang et al. 2012)実験の他の技術的な側面に主に焦点を当てている。ここでは私は次世代シーケンサー(NGS)を用いた研究において、とりわけRNA-seq技術に基づいたメッセンジャーRNA分析において、汚染細胞を検出するためのアプローチについて説明します。
(英文)
In RNA-seq experiments, NGS-derived mRNA sequences are compared with the target genome, and aligned reads are collected for all genes for which exon positions are provided in the database. One of the advantages of RNA-seq over microarray techniques is that it also provides some information about genomic sequences.
RNA-seqの実験においては、NGS由来のmRNA配列が標的ゲノムと比較される。そして、すべての遺伝子の整列させられた読み取り断片が集められる。またそのためにすべての遺伝子はエクソンの位置がデータベースに提供されている。DNAマイクロアレイ技術の中で、RNA-seqの利点の一つはゲノム配列に関するいくばくかの情報をも同時に提供することである。
(英文)
It is expected that mRNAs originate from both autosomal chromosomes and that the two (or more) alleles would thus be observed in the set of sequence fragments in NGS data. Skew in the frequency of alleles, as assessed by observed SNPs, can indicate several possible biological phenomena. The most preferable source of the skewed distribution, in terms of biological relevance, is allele-specific expression, such as genomic imprinting and mutation. However, another possible source of skewed allele frequencies is sample contamination if the contaminating cells have a different genomic background from genuine target cells.
mRNAが二つの常染色体に由来することと、それゆえ、二つ(またはそれ以上)の対立遺伝子がNGSデータの中のいくつかの系譜断片に観察されるかもしれないことは期待される。対立遺伝子頻度のゆがみは、観測されたのSNPによって評価されるように、いくつかの可能な生物学的現象を指示し得る。ゆがんだ分布の最も好ましい原因は、生物学的関係の条件下で、ゲノムインプリンティング、突然変異などの対立遺伝子の特異的発現が有った場合である。しかしながら、混入細胞が本物の標的細胞とは異なるゲノム背景を持っている場合には、歪んだ対立遺伝子頻度のもうひとつの可能な原因としてサンプルの汚染がある。
(英文)
Although allele frequencies are dependent on the PCR efficiency of each allele, and, in this analysis, variance of the distribution was especially dependent on PCR conditions, the average was approximately 50% for heterozygous SNPs, independent of the cell type.
対立遺伝子頻度は各対立遺伝子のPCR効率に依存しているけれども、またこの分析では分布の分散が特にPCR条件に依存していたが、細胞型とは独立して、平均はヘテロ接合のSNPの約50%であった。
(英文)
Allele frequency in RNA-seq has been used to detect imprinted genes (DeVeale et al. 2012; Lagarrigue et al. 2013). The approach described here extends the application of variation databases for the detection of contaminating cells in RNA-seq studies using heterozygous SNPs. Furthermore, this approach also provides a method for detecting chromosomal abnormalities. Skewed allele frequencies in a specific chromosome can be caused by aneuploidy. As aneuploidy can cause various types of abnormalities, we can exclude data from abnormal cells in studies when aneuploidy is not expected in the target tissue.
RNA-seqの中の対立遺伝子頻度はインプリント遺伝子を検出するために使用されてきている(DeVeale et al. 2012; Lagarrigue et al. 2013)。ここで説明するアプローチはヘテロ接合のSNPを用いたRNA-seqの研究の中で、汚染細胞汚検出のためのバリエーションデータベースの適用を拡張します。さらに、このアプローチは、染色体異常を検出する方法をも提供します。特定の染色体におけるゆがんだ対立遺伝子頻度は異数性によって引き起こされ得ます。異数性は多様なタイプの異常を引き起こしうるので、異数性が標的組織に期待されていない場合、我々は研究における異常細胞からのデータを除外することができる。
(英文)
This method is applicable for retrospectively evaluating the quality of experiments and is useful for interpreting results that are not apparently reproducible.
この方法は遡及的に実験品質を評価するために適用可能であると同時に、明らかに再現性がない結果を解釈するのに便利です。
- 2019/05/14(火) 09:48:44|
- 遠藤論文
-
-
| コメント:0
(英文)
Results and discussion
Mathematical model and simulation
Diploid cells have pairs of homologous chromosomes, and genes are expressed from the paternal and maternal chromosomes at roughly the same frequency, except in the case of imprinted genes and for genes on sex chromosomes (DeVeale et al. 2012; Lagarrigue et al. 2013). The frequency of expression of a sequence from a parent is expected by chance to follow a binomial distribution. Because bias caused by PCR amplification can affect this distribution, the influence of PCR bias was examined. When we consider nonimprinting genes having heterozygous SNPs, the allele frequency is expected to be approximately 50% for samples that consist of only one cell type, and the unbalanced representation of certain SNPs caused by contamination should appear as a shift in the distribution peaks.
結果と検討
数理モデルとシミュレーション
二倍体細胞は相同染色体のペアを持っています。遺伝子は、インプリント遺伝子の場合と性染色体上の遺伝子を除き、父方と母方の染色体からおよそ同一の頻度で提供されている(DeVeale et al. 2012; Lagarrigue et al. 2013)。片親からの配列の発現頻度は、二項分布に従う見込みによって期待されている。 PCR増幅に起因するバイアスがこの分布に影響を与える可能性があるため、PCRバイアスの影響を調べた。ヘテロ接合のSNPを有するノンインプリンティング遺伝子を考える際、対立遺伝子頻度は、ひとつの細胞型で構成されたサンプルの約50%であると予測され、かつ汚染によって引き起こされた特定のSNPのアンバランスな表現は分布ピークのシフトとして表われてくるはずです。
(英文)
A simulation was carried out to illustrate how contaminating cells affect the simple binomial distribution of allele frequencies. When the number of the reference allele (A) is nA and that of the alternative allele (a) is na, the chance of detection of the reference allele is nA/(nA + na). In RNA-seq experiments, bias originating from PCR should be considered. To simplify the model, the PCR bias was incorporated by assuming that the sequences containing A and a were amplified 2α and 2β times, respectively. If we obtain N fragments of the locus with RNA-seq, the probability of k reference allele sequences is calculated as follows:
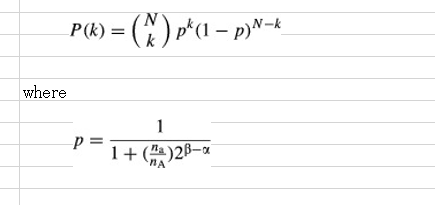
混入細胞が対立遺伝子頻度の単純な二項分布にどのように影響するかを図示するためにシミュレーションが実施された。参照対立遺伝子(A)の数をnA、代替対立遺伝子(a)のそれをnaとするとき、参照対立遺伝子の検出の可能性はnA /(nA+ na)である。 RNA-seqの実験では、PCRから生じるバイアスを考慮しなければならない。モデルを単純化するために、PCRバイアスはA及びaを含む配列がそれぞれ、2のα乗と2のβ乗倍に増幅されたと仮定して組み込まれた。もし我々がRNA-seqの持つ遺伝子座のN断片を得た場合は、k個の参照対立遺伝子配列の確率は次のように計算される。
(続き)
The simulation in Fig. 1A was carried out using conditions where N = 50 and β - α followed a Gaussian distribution, having standard deviation of 0 (no PCR bias) or 1 (high PCR bias). The simulation indicated that the variance of the distribution was highly dependent on PCR bias and that the mode of the distribution corresponded to the composition of SNP alleles. Allele frequencies of several sets of RNA-seq data from various cell types obtained from public databases were examined, and the results agreed with the simulation (Fig. 1B). Peaks at 0 and 100% might result from the homozygous SNPs in observed cells. An artificial contaminating situation was also generated with random sampling of RNA-seq datasets from two cell categories, pure C57BL/6 (B6) hematopoietic stem cells (HSCs), and a mixture of 129 and B6 embryonic stem cells (129B6F1 ESCs) at various ratios. The curve shape and peak positions varied along the ratio as shown in the mathematical simulation (Fig. 1C, gray line).
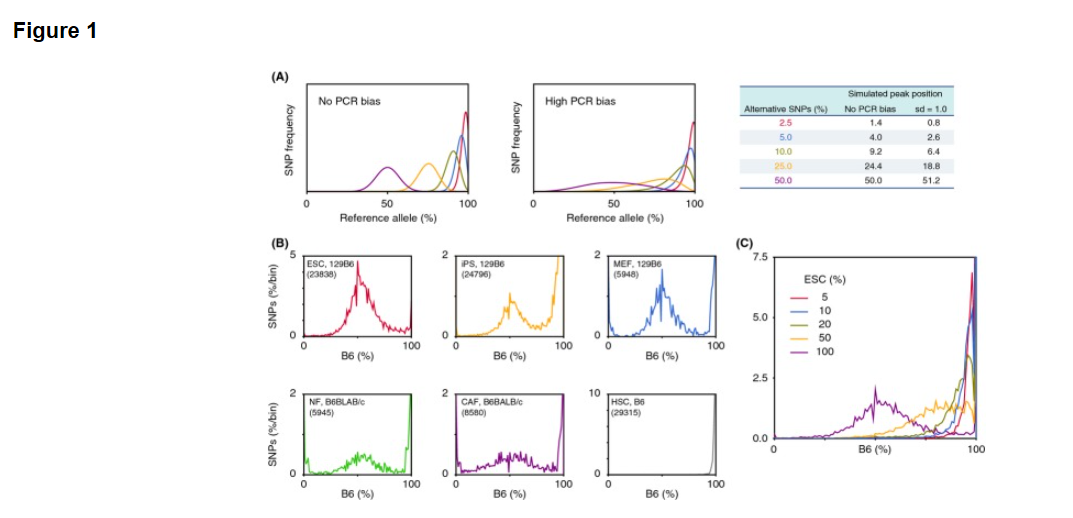
図1AのシミュレーションはN= 50で、かつ標準偏差が0(無PCRバイアス)または1(PCRバイアス)を有する ガウス分布に従ったβ-α条件を用いて行った。シミュレーションは分布の分散がPCRバイアスに依存的であったこと、分布様式が対立遺伝子の組成に対応していることを示した。公開データベースから得られた様々な細胞型からRNA-seqのデータのいくつかのセットの対立遺伝子頻度を調べた結果、シミュレーション(図1B)と一致した。 0%と100%でのピークは観察された細胞内のホモ接合のSNPに起因する可能性があります。人工汚染状況はまた2つのセルのカテゴリからのRNA-seqのデータセットのランダムサンプリングによって作られています。それは純粋なC57BL / 6(B6)の造血幹細胞(HSC)と各種129及びB6胚性幹細胞(129B6F1のESC)の各種比率の混合物の二つです。数学的シミュレーション(図1C、灰色の線)のように曲線形状とピーク位置はその比率に沿って変化しています。
(Fig. 1のリジェンド)
Figure 1. Allele frequency analysis of RNA-seq data. (A) Simulation of SNP allele frequencies using a modified binomial distribution. Peak position was determined by the composition of two alleles, and variance of the distribution was dependent on sd, standard deviation of simulated PCR bias. (B) SNP distributions in several cell types. ESCs (red, SRR1047502, 129B6F1 background), iPSs derived from fibroblasts (yellow, SRR1047504, 129B6F1), MEFs (blue, SRR104220, 129B6F1), normal fibroblasts (NFs; green, SRR1191170, B6 x BALB/c), cancer-associated fibroblasts (CAFs; purple, SRR1191171, B6 x BALB/c), and HSCs (gray, SRR892995, B6). The number of applied SNPs for each cell type is shown in parentheses in each box. (C) Allele frequency of HSC samples contaminated with different percentages of ESCs as shown.
[図1] RNA-seqデータの対立遺伝子頻度解析。(A)修正された二項分布を用いたSNPの対立遺伝子頻度のシミュレーション。ピーク位置は、2つの対立遺伝子組成物により決定され、分布の分散はsd、即ちシミュレートされたPCRバイアスの標準偏差に依存している。(B)いくつかの細胞型におけるSNP分布。ESCs<ES細胞>(赤、SRR1047502、129B6F1背景) 、線維芽細胞から誘導されたiPSs<iPS細胞>(黄色、SRR1047504、129B6F1)、MEF<マウス胎児線維芽細胞:フィーダー細胞>(青、SRR104220、129B6F1)、正常な線維芽細胞(NFs;緑、SRR1191170、B6 X BALB/ c )、癌化した線維芽細胞(CAFs;紫、SRR1191171、B6 x BALB / c)及びHSCs<造血幹細胞>(灰色、SRR892995、B6)。各細胞型のために適用されたSNPの数は各ボックス内の括弧内に示されている。 (C)示されたES細胞の異なる割合で汚染された造血幹細胞資料の対立遺伝子頻度。
(本文続き)
Re-analysis of STAP paper: Genotype analysis of fibroblast growth factor-induced stem cells (FI-SCs)
This study examined how SNP allele frequencies in RNA-seq data can be used to show properties of the dataset. Obokata et al. recently reported the phenomenon of STAP, the induced cellular reprogramming of committed somatic cells into pluripotent stem cells that can produce embryonic and placental tissues when injected into blastocysts (Obokata et al. 2014a,b). The allele frequency approach described above was used to examine the NGS dataset provided by the researchers. Allele frequencies between reference allele (equivalent to B6 genotype for dbSNP) and alternative allele (corresponding to 129 genotype in this study) were examined in RNA-seq data from seven replicate experiments obtained using the TruSeq reagent (Figs 2A and S1 in Supporting Information).
STAP論文の再解析: 線維芽細胞増殖因子によって誘導される幹細胞(FI-SC
)の遺伝子型解析
この研究はRNA-seqデータの中のSNP対立遺伝子頻度がいかにしてデータセットのプロパティを表示しうるに至るのかを検討している。 小保方らは最近STAP現象を報告した。それは胚盤胞に注入された場合に胚および胎盤組織を作り出すことができる多能性幹細胞へと変化した体細胞の誘導細胞再プログラミングを意味する(Obokata et al. 2014a,b)。上述の対立遺伝子頻度のアプローチは研究者らによって提供されているNGSデータセットを調べてきたものである。参照対立遺伝子(dbSNPのB6遺伝子型に相当)と、代替の対立遺伝子(この研究では129の遺伝子型に対応する)間の対立遺伝子頻度は、TruSeq試薬を使用して得られた7回の反復実験から得られたRNA-seqデータの中で検討されている(サポート情報の図2AおよびS1) 。
(英文)
The allele distributions of six of the seven experiments showed the equal representation of parental chromosomes expected in Fig. 1A. For the experiments that involved ESCs, STAP cells, and STAP stem cells (STAP-SCs), there were no 0% peaks (Fig. S1 in Supporting Information), possibly because the cells were obtained from mice backcrossed in the laboratory that may have a different genotype than those in the public database.
7回の実験中6回の対立遺伝子分布は図 1Aで期待されている親の染色体と同じ表現を示した。ES細胞、STAP細胞、およびSTAP幹細胞(STAP-SCS)を含む実験では全くの0%のピークは無かったが(サポート情報の図S1)、おそらく細胞が実験室で戻し交配されたため、公開データベース (J. Sharif and K. Isono, personal communication)のものとは異なる遺伝子型のマウスから得られたからであろう。
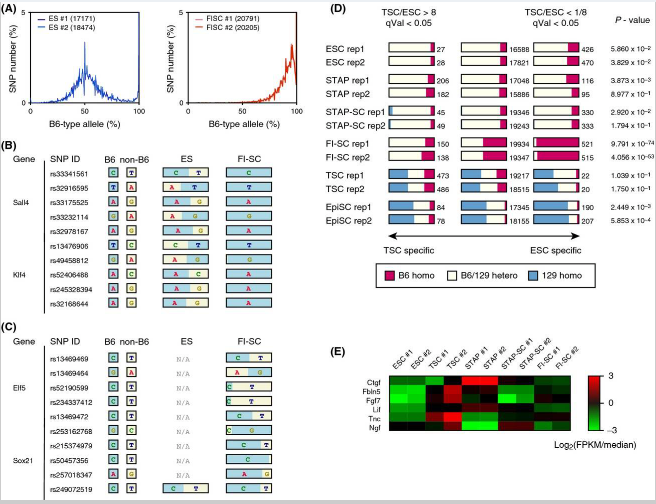
(Fig. 2のリジェンド)
Figure 2. SNPs detected in FI-SC mRNAs indicating contamination. (A) Allele distributions obtained from ESC and FI-SC RNA-seq experiments used in the STAP paper. Both ESCs (blue) and FI-SCs (red) are annotated as having a 129B6F1 genetic background. The number of applied SNPs for each experiment is shown in parentheses in the boxes. (B) SNPs detected in Sall4 and Klf4, which are highly expressed in ESCs. B6-type alleles are shown in blue and 129-type alleles (i.e., non-B6) are in yellow. (C) SNPs detected in the TSC-specific genes Elf5 and Sox21. (D) The number of homozygous/heterozygous SNPs observed in the stem cells used in the original paper. Only the composition observed in FI-SCs would be predicted to affect gene expression. P-values were calculated using Fisher's exact test of genotype distribution between TSC-specific genes and ESC-specific genes. Rep1 and rep2 denote two replicated experiments. (E) Heatmap of representative cytokine and extracellular matrix genes that are highly expressed in MEFs. Normalized log ratios of fragments per kilobase of exon per million reads (FPKM) against the medians of all samples were shown.
[図2] 汚染を示すFI幹細胞のmRNAで検出されたSNP。 (A)STAP論文に使用されたES幹細胞とFI幹細胞のRNA-seqの実験から得られた対立遺伝子分布。ES幹細胞(青)とFI幹細胞(赤)の両方とも129B6F1遺伝子背景を有していると注釈されている。各実験のために適用されたSNPの数は、ボックス内の括弧で示されている。(B)ES幹細胞で高頻度で発現されるSall4及びKlf4で検出されたSNP。 B6型対立遺伝子は青で、129型対立遺伝子(すなわち、非B6)は黄色で示されている。 (C)TS細胞特異遺伝子Elf5及びSox21で検出されたSNP。 (D)元の論文で使用された幹細胞で観察された沢山のホモ接合/ヘテロ接合SNP。 FI肝細胞の中で観察された組成物だけが遺伝子発現に影響を与えると予測される。 P値はTS細胞特異遺伝子およびES細胞特異遺伝子間の遺伝子型分布のフィッシャーの正確確率検定を用いて計算されている。 REP1およびREP2は、2つの反復実験を表す。(E)代表的なサイトカインおよび高頻度で胎児線維芽細胞に発現る細胞外マトリックス遺伝子のヒートマップ。全サンプルの中央値に対する万単位読み取り断片あたりの千単位エクソン断片の正規ログ比(FPKM)が示されている。
(本文続き)
Surprisingly, FI-SCs that were annotated as coming from the F1 129Sv (129) and B6 cell populations did not show the allele distribution pattern of unbiased nonimprinting genes (Fig. S1 in Supporting Information). The distribution was more similar to that of cells with unequal chromosomes. These FI-SCs were reported to be induced from STAP cells with Fgf4 and to have characteristics similar to trophoblast stem cells (TSCs), such as their gene expression profiles and potential to contribute to the placenta (Obokata et al. 2014a).
驚くべきことにF1 129SV(129)とB6の細胞集団由来と注釈されているFI幹細胞はバイアスのないノンインプリンティング遺伝子の対立遺伝子分布パターンを示さなかった(サポート情報の図S1)。分布は不均等な染色体を有する細胞のものにより類似している。これらのFI肝細胞はFGF4<線維芽細胞増殖因子-4 >によったSTAP細胞から誘導され、かつそれらの遺伝子発現の特徴と胎盤に貢献する能力のように、栄養膜細胞(TS細胞)に似た特性を有することが報告されている(Obokata et al. 2014a)。
(英文)
The obvious difference in the FI-SC curve from the 129B6F1 genotype, combined with the fact that the majority of SNPs were similar to B6, suggested that the FI-SCs originated from neonatal mice of a nearly pure B6 background. Further analysis of gene expression patterns suggested that the heterogeneity of SNPs between B6-type allele and non-B6 could be caused by the expression characteristics of genes. As shown in Fig. 2B, SNPs expected to be heterogeneous between 129 (i.e., non-B6) and B6 were examined in several ESC marker genes. ESCs carried alleles from both the 129 and B6 backgrounds at these loci, but the FI-SCs, although described as having the same genetic background as the ESCs (Obokata et al. 2014a), carried only SNPs from B6. This dominance of the B6 genotype was not observed in TSC marker genes (Fig. 2C).
大多数のSNPがB6と似ているという事実と組み合わせると、129B6F1遺伝子型とFI幹細胞曲線の明らかな差異はFI幹細胞がほぼ純粋なB6バックグラウンドの新生仔マウスに由来することを示唆している。遺伝子発現パターンの更なる分析は、B6型対立遺伝子と非B6間のSNPの不均一性が遺伝子発現特性に起因することが示唆されている。図2Bに示めされているように、129(すなわち、非B6)およびB6間で異質であることが期待されているSNPは、いくつかのES細胞マーカー遺伝子の中で調べられている。ES細胞はこの遺伝子座において129とB6の両方のバックグラウンドからの対立遺伝子を持ち込んでいるが、FI幹細胞は、ES細胞と同じ遺伝子背景を持つと書かれているにもかかわらず(Obokata et al. 2014a)、B6からの対立遺伝子しか持ち込んでいない。 B6遺伝子のこの優勢はTS細胞のマーカー遺伝子には観察されなかった(図2C)。
(英文)
The FI-SC specificity was not limited to the genes shown in Fig. 2B and C. When all heterogeneous SNPs were classified into three groups, SNPs in ESC-specific genes, SNPs in TSC-specific genes, and SNPs in other genes, only FI-SCs had widely heterozygous SNPs for these groups (Fig. 2D). If all included cells in a sample share the same cellular features, one would not expect to see this phenomenon of particular gene sets having different genotypes.
FI幹細胞の特異性は図2B及びCに示す遺伝子に限定されなかった。すべての異質SNPが、ES細胞に特異的遺伝子のSNP、TS細胞に特異的遺伝子のSNP、および他の遺伝子のSNPの3つのグループに分類されているとき、FI幹細胞のみがこれらのグループに広くヘテロ接合のSNPを有していた(図2D)。試料中に含まれるセルのすべが同じ細胞の特徴を共有している場合、異なる遺伝子型を有する特定の遺伝子セットのこの現象は見られ得ないであろう。
(英文)
Because the FI-SCs showed a specific genotype at some TSC markers, they may have been contaminated with TSCs. Feeder cells, however, could be another source of contamination, as the FI-SCs were cultured with mouse embryonic fibroblast (MEF) feeder cells whose genotype was not described in the original paper. For this study, the expression of marker genes for MEFs was examined and compared with the expression of ESC and TSC markers, and the results indicated the absence of expression of these MEF genes in FI-SCs (Fig. 2E). The probability of contamination by MEFs is therefore negligible, and the most likely explanation for the skewed distribution of allele frequencies detected in the duplicated RNA-seq experiments is that the FI-SC population originated from two cell types: ESC-like cells having a B6 genetic background and TSC-like cells having a genotype similar to that of CD1, which is a mouse strain other than B6 and 129.
FI幹細胞はいくつかのTS細胞マーカーで特定の遺伝子型を示したので、それらはのTS細胞で混入汚染されている可能性がある。しかしながら、 FI幹細胞がその遺伝子型が元の論文に記載されていないマウス胚性線維芽(MEF)フィーダー細胞とともに培養されていたとしたら、フィーダー細胞も混入汚染の他の原因でありうる。この研究にとって、MEF<マウス胚性線維芽細胞>のためのマーカー遺伝子の発現は調べられており、かつ、ES細胞とTS細胞のマーカー発現と比較されていて、その結果はFI幹細胞の中のこれらのMEF遺伝子の発現の欠如を示している(図2E)。 従ってMEF<胚性線維芽細胞>の混入の可能性は無視でき、かつ、重複RNA-seqの実験で検出された対立遺伝子頻度の傾斜分布の最も可能性の高い説明は、FI幹細胞の集団が次の2つの細胞型に由来していることである:B6遺伝子背景を有するES様細胞と、B6と129以外のマウス株で、CD1と同様の遺伝子型を有するTS様細胞。
- 2019/05/14(火) 10:01:28|
- 遠藤論文
-
-
| コメント:0
(英文)
Re-analysis of a retracted paper: Detection of chromosomal aberrations
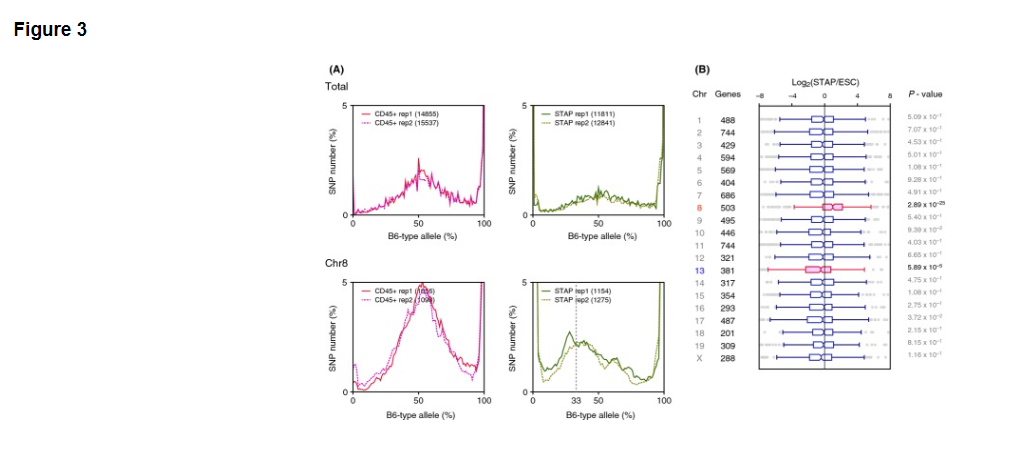
SNP distribution analysis can also be applied to detect aneuploidy. In examining allele frequencies for each chromosome, abnormal chromosomes are assumed to have skewed distributions when paired chromosomes do not have the equal number of duplicates. As shown in Fig. 3A, chromosomal analysis showed abnormality of chromosome 8 in the STAP cells used in the original study. We can expect the peak allele frequency to occur at approximately 50% if a cell has two chromosomes from parents of different strains. The peak allele frequency of the STAP cells, however, was at approximately 33%, meaning that one of the two chromosomes appears to be duplicated leading to three copies of chromosome 8.
撤回された論文の再分析:染色体異常の検出
SNPの分布分析は異数性を検出するためにも適用することができる。各染色体についての対立遺伝子頻度を調べる際には、対の染色体が同数の複写をもたないときに、異常な染色体が歪んだ分布を持つのだと推定される。図3Aに示すように、染色体分析は最初の研究で使われたSTAP細胞における8番染色体の異常を示している。細胞が異なる株の親からの2つの染色体を持っている場合には、我々はピーク対立遺伝子頻度が約50%に起こることを期待することができ.る。 STAP細胞のピークの対立遺伝子頻度は、しかし、約33%であった。それは2つの染色体の一つが染色体8の3つのコピーをもたらすように複製されたように見える。
(英文)
The STAP cells used in the experiments were derived from 129 and B6 cells, and the duplicated chromosome is presumed to be from the 129 parent because it contained only non-B6 SNP alleles. It is notable that trisomy 8 is the most common chromosomal aberration in mouse ESCs, with 31 of 97 examined cell lines reported to carry this abnormality (Mayshar et al. 2010). ESCs having trisomy 8 have a growth advantage, but chimeras will not transmit the mutation to the germ-line (Ben-David et al. 2013), and trisomy 8 in mice results in prenatal death by day 12 or 13 (Kim et al. 2013).
実験で使用されたSTAP細胞は129とB6細胞由来である。重複染色体は129の親からのものであると推定される。なぜならそれが唯一の非B6のSNP対立遺伝子を含んでいたためである。トリソミー8がマウスES細胞の中での最も一般的な染色体異常であることは注目に値する。それは97回の細胞株を調べたうちの31回この異常をもつと報告されていることである(Maysharら、2010)。トリソミー8を持つES細胞は生育が優性であるが、キメラは生殖系列への変異を引き起こさず(Ben-David et al. 2013)、マウス内のトリソミー8は12日目または13日目での出生前死亡をもたらします (Kim et al. 2013)。
(Fig. 3のリジェンド)
Figure 3. Trisomy detected by SNP analysis of RNA-seq data. (A) Allele frequency distributions of whole chromosomes and chromosome 8. Only chromosome 8 of STAP cells had a peak that was not centered approximately 50%, indicating that chromosome 8 originating from the 129 strain was duplicated to produce trisomy of the chromosome. Unlike the RNA-seq data analyzed in Figs 1 and 2, the RNA-seq data analyzed in this figure were generated using the SMARTer reagent kit. (B) Expression analysis by chromosome. Only genes on chromosome 8 were significantly more expressed, and genes on chromosome 13 were significantly less expressed. P-values were calculated using two-sided Student t-tests.
[図3] RNA-seqデータのSNP解析によって検出されたトリソミー。 (A)全染色体と8番染色体の対立遺伝子頻度分布。STAP細胞の8番染色体のみが約50%を中心としないピークを持っていた。それは129株起源の8番染色体が染色体のトリソミー生成するように複製されたことを示す。図1及び図2で分析されたRNA-seqデータとは異なり、この図において分析されているRNA-seqデータはSMARTer試薬キットを使用して作られている。(B)染色体ごとの発現解析。 8番染色体上の遺伝子のみが有意に多く発現しし、13番染色体上の遺伝子が有意に低い発現している。 P値は二群スチューデントt検定を用いて計算されている。
(本文続き)
Because aneuploidy detection using transcriptome analysis has been reported (Gropp 1982; Liu et al. 1997), the expression of genes on each chromosome was analyzed in this study. Genes on chromosome 8 and chromosome 13 had significantly different expression patterns between STAP cells and ESCs. Chromosome 8 gene expression was 1.3 times higher in STAP cells than in ESCs (P-value = 2.89 × 10⁻²⁵; Fig. 3B). This result is concordant with trisomy of chromosome 8 as detected by SNP analysis. The SNP allele frequency method used here can, therefore, be used to detect aneuploidy if we know the SNP genotype of the cells and if the control cells have a normal karyotype.
メッセンジャーRNA解析を用いた異数性検出が報告されているので(Gropp 1982; Liu et al. 1997)、各染色体上の遺伝子発現を本研究で分析した。 8番染色体と13番染色体上の遺伝子はSTAP細胞とES細胞の間で有意に異なった発現パターンを持っていた。第8染色体遺伝子発現はES細胞よりSTAP細胞において1.3倍高かった(P-value = 2.89 × 10⁻²⁵; 図3B)。この結果はSNP解析によって検出された8番染色体のトリソミーと一致している。ここで使用されているSNP対立遺伝子頻度法は、したがって、我々が細胞のSNPの遺伝子型を知っていて、かつ、対照細胞が正常な核型を持っている場合には異数性を検出するために使える。
(英文)
Availability of SNP allele frequencies
The SNP allele frequency method detected contaminating cells in samples used to generate RNA-seq data, but the sensitivity of this method is dependent on the depth of sequence reads. Based on the limited number of RNA-seq datasets here, the graphs become too noisy to detect differences in the distributions if the number of available SNPs is fewer than approximately one thousand. For example, MEF cells having only 5948 SNPs generates a more noticeable amount of spikes than data for ESCs with 23 838 SNPs. SNPs assigned to each chromosome also suggested that the distributions could be very noisy when the number of SNPs become <1000 (Fig. S2 in Supporting Information). Cover ratios are also important for the sensitivity because the variance of binomial distribution depends on the number of trials. Therefore, when the average cover ratio is required to be 20× for all genes, the required read count will be approximately 1.3 × 10⁹ nucleotides, roughly corresponding to a read count of approximately 1.1 × 10⁹ bases, which was used to derive the distribution for MEFs (Fig. 1B).
SNP対立遺伝子頻度の有効性
SNP対立遺伝子頻度手法はRNA-seqデータを作成しようとするときに通常使用されるサンプル中の汚染細胞を検出するが、この手法の感度は配列リードの長さに依存する。ここで限られた数のRNA-seqデータセットを仮定すると、利用可能なSNPの数がおよそ千よりも少ない場合は、グラフは分配の違いを検出するにはあまりに雑音が多くなる。例えば、5948個のSNPを持つMEF<マウス胎児線維芽細胞>は23838個のSNPを持つES細胞のデータよりもスパイクのより顕著な量を生成する。各染色体に割り当てられたSNPはまた、SNPの数が1000より小さいときの分布が非常にノイズが多くなりがちなことを示唆している(サポート情報の図S2)。二項分布の分散は試行回数に依存しているため、感度にとってはカバー率も重要である。それ故、平均カバー率がすべての遺伝子の20倍であることが要求されている場合、必要な読み出し回数は、MEF<マウス胎児線維芽細胞>の分布を導出するために使用された約1.1×10⁹塩基のリード回数にほぼ対応するところの、約1.3×10⁹ヌクレオチドであろう(図1B)。
(英文)
Figure 1B also indicates some interesting aspects of genome stability of induced pluripotent stem (iPS) cells. The iPS cells generated from 129B6F1 had more homozygous SNPs of B6-type alleles. Although, as noted earlier, this may be the result of cellular contamination or this could be the result of differences in the properties of the cells used in the two experiments, there is also the intriguing possibility that the experimental process induced a transition of genotypes. As iPS cell engineering has been reported to induce genomic and/or epigenomic instability (Hussein et al. 2011; Chang et al. 2014), it will be important to examine allele frequencies of iPS cells in future studies.
図1Bはまた人工多能性幹細胞(iPS)のゲノム安定性のいくつかの興味深い側面を示している。 129B6F1から生成されたiPS細胞はB6型対立遺伝子のよりホモ接合したSNPを有していた。先に述べたように、これは細胞の汚染の結果であるかもしれないし、この二つの実験で使用された細胞の性質の違いの結果である可能性もあるが、実験プロセスが遺伝子型の転移を誘導したという魅力的な可能性もある。 iPS細胞工学がゲノム的な、および/または、ゲノム外環境的な不安定性を誘導すると報告されているように (Hussein et al. 2011; Chang et al. 2014)、今後の研究においてiPS細胞の対立遺伝子頻度を調べることが重要となるでしょう。
(英文)
SNP frequency differences detected in RNA-seq or other NGS experiments are probably not more accurate than those detected by direct observation of karyotypes; however, the method described in this study can be used to detect chromosomal abnormalities even if the test cells are no longer available, and from both genotype (SNPs) and phenotype (gene expression), which is expected to provide more reliable evidence than genotype or phenotype alone.
RNA-seqや他のNGS実験で検出されたSNP頻度の違いは、おそらく核型を直接観察することによって検出されるものと比べると、正確ではありません。しかし、この研究で記載された方法は、試験細胞がもはや利用不可能である場合でも、遺伝子型か表現型のみによるよりもより信頼できる証拠を提供することが期待されている遺伝子型(SNP)と表現型(遺伝子発現)の両者から染色体異常を検出するために使用することができます。
(英文)
One advantage of the SNP allele frequency method of this study is its potential ability to detect and determine the parental origin of chromosomes duplications. The other advantage over virtual karyotyping (Ben-David et al. 2013) is that it does not require control cells without aneuploidy because simulated models expect the allele frequencies of diploid cells would have peaks approximately 50% (Fig. 1A).
この研究のSNP対立遺伝子頻度法の1つの利点は染色体複製の親の起源を検出しかつ決定する、その潜在能力にある。仮想染色体分析(Ben-David et al. 2013)を介したもうひとつの利点は、異数性のない対照細胞を必要としないことである。なぜなら、シミュレートされたモデルはそもそも二倍体細胞の対立遺伝子頻度がピークを約50%に持っているだろうと期待しているからである(図1A)。
- 2019/05/14(火) 10:07:42|
- 遠藤論文
-
-
| コメント:0
(英文)
Contamination in FI-SC samples
Examination of allele frequencies in RNA-seq fragments enables detection of specific characteristics of the sampled cells. When a set of genes specifically expressed in a particular cell type shows a distinct genotype, the origins of the cells can be assumed. This analysis of SNPs in mRNA sequence reads from the Obokata et al. study showed that the origins of the STAP and FI-SC samples were likely different than originally reported. The simulation showed that the mode of the distribution depends both on the cellular composition of the sample and possible variance caused by PCR bias. When we ignore the PCR bias of binomial distribution, the ratio of contaminating cells can be roughly estimated by the peak position in the distribution.
FI幹細胞サンプルの汚染
RNA-seq断片の対立遺伝子頻度の検討はサンプリングされた細胞の特性検出を可能にする。特定の細胞型において特殊に発現される一組の遺伝子が異なる遺伝子型を示す場合、その細胞の起源を想定することができる。メッセンジャーRNA配列におけるSNPに関するこの分析は、提示された小保方らの研究から、STAPとFI幹細胞サンプルの起源が最初に報告されたよりも異なっているらしいことを読み取る。シミュレーションは分布の様態がサンプルの細胞組成とPCRバイアスに起因する分散の両方に依存することを示している。二項分布のPCRバイアスを無視すると、我々は混入細胞の割合を大雑把に分布のピーク位置によって推定することができる。
(英文)
The most likely cell type to be contaminating the FI-SCs in the original study, TSCs, had many more heterozygous (B6/non-B6) alleles than non-B6 homozygous alleles. SNPs of FI-SCs were counted in alleles where B6 and 129 have different nucleotides and duplicated experiments resulted in 6859 and 7243 heterozygous SNPs and 24 and 14 non-B6 homozygous alleles, respectively. The percentage of contaminating cells can be assumed with genotype observation because the peak allele frequencies were at approximately 95–96%, whereas the population peak is expected to be at approximately 10%. This result was concordant with the expression of TSC marker genes. All of the examined TSC marker genes examined were expressed in approximately 10% of TSCs (Fig. 4A).
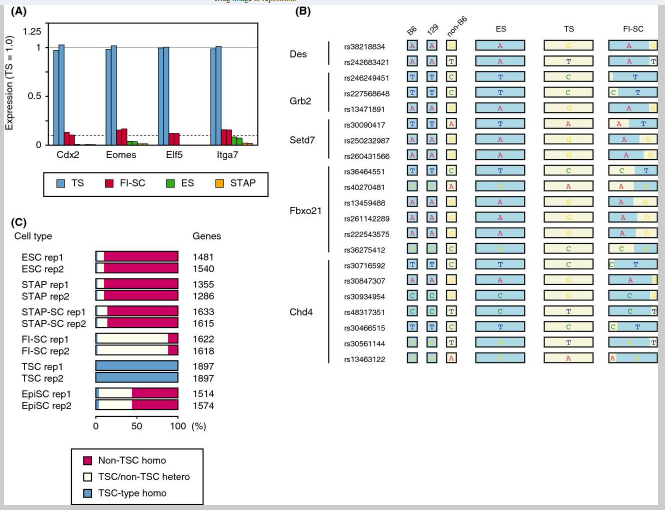
最初の研究でFI肝細胞を汚染する最も可能性の高い細胞型であるTS細胞は、非B6同型接合対立遺伝子よりももっと多くのヘテロ接合(B6/非B6)対立遺伝子を有していた。 FI幹細胞のSNPは、B6および129が異なるヌクレオチドを有し、かつそれぞれ、6859と7243のヘテロ接合SNPおよび24と14の非B6ホモ接合性対立遺伝子に結果された重複実験をされた対立遺伝子の中で数えられた。混入細胞の割合は遺伝子型観察によって推定することができる。なぜなら総数のピークが約10%であることが期待されているのに対して、ピークの対立遺伝子頻度が約95から96パーセントであったためである。この結果はTS細胞のマーカー遺伝子の発現と一致している。調べられたTS細胞のマーカー遺伝子の全てが約10%のTS細胞(図4A)の中で発現している。
(Fig. 4のリジェンド)
Figure 4. Examination of incorporated mRNAs in FI-SCs. (A) Expression of TSC marker genes in ESCs, TSCs, and FI-SCs. The solid line indicates the average TSC gene expression and dashed line indicates 10% of the average. (B) Heterozygous SNPs detected in Des, Grb2, Setd7, Fbxo21, and Chd4 where B6 and 129 share the same SNPs but TSCs did not. (C) Gene-wise analysis of distribution of heterozygous/homozygous SNPs having TSC-specific alleles.
[図4] FI幹細胞に組み込まれたメッセンジャーRNAの検討。 (A)ES細胞、TS細胞及びFI幹細胞の中のTS細胞マーカー遺伝子の発現。実線は平均のTS細胞遺伝子発現を示し、破線は平均の10%を示している。 (B)B6と129が同じSNPを共有し、TS細胞はそうでない場合にDes、Grb2、Setd7、Fbxo21、およびChd4で検出されたヘテロ接合SNP。(C)TS細胞独自の対立遺伝子を有するヘテロ接合/ホモ接合のSNP分布のジーンワイズ分析。
(本文続き)
FI-SC-specific SNPs were also examined where B6- and 129-derived sequences shared the same nucleotide but FI-SC-derived ones did not. Most of these SNPs matched with the CD1 background of the TSCs used in the experiment and were different from B6 or 129. Gene-by-gene representation (Fig. 4B) and whole-SNP analysis (Fig. 4C) showed that FI-SCs shared TSC-specific SNPs. As the proportion of contaminating TSCs in the FI-SCs was minor, most of the TSC-specific SNPs appeared heterozygous. These results support the view that the RNA-seq data contained transcripts from two major cell populations, with approximately 90% B6 cells having an ESC-like expression pattern and approximately 10% CD1-like cells having a TSC-like pattern. Therefore, the claim in the Obokata et al. paper that FI-SCs contribute to the placenta might have been based in error on contamination by TSCs, which are known to be organ stem cells (Tanaka et al. 1998).
B6と129由来の配列が同じヌクレオチドを持ち、かつFI幹細胞由来のものはそうでない場合のFI幹細胞独自のSNPが検討された。これらのSNPの大部分は実験で使われたTS細胞のCD1バックグラウンドと一致し、かつB6または129とは異なっていた、対応遺伝子ごとの表示(図4B)及び全SNP分析(図4C)はFI幹細胞がTS細胞独自のSNPを共有していることを示している。FI幹細胞の中に混入したTS細胞の割合が軽微だったので、TS細胞独自のSNPのほとんどがヘテロ接合として現れた。これらの結果は、RNA-seqデータが、ES細胞のような発現パターンを持つ約90%のB6細胞と、TS細胞のようなパターンを有する約10%のCD1のような細胞の、二つの主要な細胞集団からの転写物を含んでいるという見解を支持する。したがって、FI幹細胞が胎盤に貢献するという小保方ら論文の主張は臓器幹細胞であることが知られている(Tanaka et al. 1998)TS細胞の混入による間違いを根拠にしているかも知れない。
(英文)
Interpretation of the STAP phenomenon
Detection of aneuploidy using SNPs also suggested contamination in the original experiments. Both genotype and phenotype analyses suggested that the STAP cells used in the Obokata et al. experiments had trisomy of chromosome 8, and a transcription assay indicated atypical expression of genes on chromosome 13. Trisomy 8 is the most common chromosomal abnormality in mice, and chromosome 8 has been reported to fuse to the end of chromosome 13 (Kim et al. 2013). These observations might explain the results of virtual karyotyping in Fig. 3B. The RNA-seq data used in Fig. 3 were annotated as being derived from neonatal mouse spleen cells cultured in conditions under which the STAP cells did not grow. This description does not agree with the dominance of cells having trisomy because mice carrying pure trisomy 8 are embryonic lethal. This therefore leads to the conclusion that the cells were cultured cells that possessed expression characteristics that were very similar to those of ESCs.
STAP現象の解釈
SNPを使った異数性検出はまた元の実験に汚染のあることを示唆している。遺伝子型と表現型の両方の解析はObokataらの実験で使用されたSTAP細胞が8番染色体にトリソミーを有することを暗示し、転写因子検査は13番染色体上に遺伝子の異型の発現があることを示している。トリソミー8はマウスにおいて最も一般的な染色体異常であり、第8番染色体は13番染色体の末端に融合することが報告されている (Kim et al. 2013)。これらの観察は図3(b)の仮想染色体分析の結果を説明しているかもしれない。図3で使用されたRNA-seqデータは、STAP細胞が増殖しなかった条件下で培養された、新生児マウス脾臓細胞に由来するとして注釈されている。純粋なトリソミー8を有するマウスは胎生致死であるため、この記述は、トリソミーを有する細胞の優位性とは一致しない。したがって、これは、細胞がES細胞のものと非常に類似した発現特性を保有する培養細胞であったという結論に導く。
(英文)
Conclusion
The SNP allele frequency method described here is limited by the fact that if the contaminating and examined cells share a common genetic background, the allele frequencies will not be different enough to detect the contamination. However, this method is, in principle, applicable to any RNA-seq data that contain polymorphisms and will be useful for both prospective and retrospective quality control of RNA-seq experiments, especially for studies using cultured cells such as ESCs and iPS cells and their derivatives.
結論
ここで記述されたSNP対立遺伝子頻度法は汚染検査されている細胞が共通の遺伝的背景を共有している際には、対立遺伝子頻度が汚染を検出するのに十分なだけ異ならないかもしれないという事実によって制約されている。しかし、この方法は、原理的には、多型を含むどのRNA-seqのデータにも適用可能であり、また前向きであれ遡及的であれ両方の品質管理のために、特にES細胞やiPS細胞及びそれらの派生細胞などの培養細胞を用いた研究にとって、有用であろう。
(英文)
Experimental procedures
Dataset
Mouse variation data were obtained from the Sanger Mouse Genomes Project (*ttp://www.sanger.ac.uk/resources/mouse/genomes/), and the version 137 VCF-formatted dataset was retrieved from dbSNP (*ttp://www.ncbi.nlm.nih.gov/SNP/).
The locations of genes and included exons were obtained from iGenomes (*ttp://support.illumina.com/sequencing/sequencing_software/igenome.ilmn). SNPs outside exons were excluded from the original VCF file using this annotation, and thus, 1 016 227 SNPs were used for the entire dataset.
<実験手順>
データセット
マウスバリエーションデータはサンガーマウスゲノムプロジェクト (*ttp://www.sanger.ac.uk/resources/mouse/genomes/)から入手された。またバージョン137 VCF-フォーマットデータセットはdbSNP (*ttp://www.ncbi.nlm.nih.gov/SNP/)から検索された。
遺伝子および含まれているエキソンの位置はiGenomes(*ttp://support.illumina.com/sequencing/sequencing_software/igenome.ilmn)から入手された。 エキソンの外側にあるSNPはこのiGenomesの注釈を使用して元のVCFファイルから除外されている。従って1016227のSNPはデータセット全体のために使用されている。
(英文)
Raw sequencing data from the original RNA-seq experiments examined in this study were downloaded from the short read archive (SRA) at NCBI. The accession number of the project is SRP038104. Genome sequences of mouse (version 38, mm10) obtained from B6 mouse strain were downloaded from NCBI GenBank and encoded into a bowtie database using the bowtie-build (for colored space fastq files) or bowtie2-build (for fastq files) program. The accession numbers (i.e., SRA ID) of the RNA-seq experiments are listed in Table S1 (Supporting Information), and the checksums of archived sequences were confirmed by Dr Teruhiko Wakayama, Yamanashi University, one of the corresponding authors of the original paper.
この研究で調べられた元のRNA-seq実験からの生シーケンシングデータは、NCBIのショートリードアーカイブ(SRA)からダウンロードされた。 プロジェクトの受託番号はSRP038104である。 B6マウス株から得られたマウスのゲノム配列(バージョン38、mm10)をNCBI GenBankからダウンロードし、bowtie-build(着色スペースfastqファイル用)またはbowtie2-build(fastqファイル用)プログラムを使用してbowtieデータベースにコード化した。 RNA-seq実験の受託番号(すなわち、SRA ID)は表S1(支援情報)に列挙され、アーカイブされた配列のチェックサムは原著論文の責任著者の一人である山梨大学若山照彦博士によって確認されている。
(英文)
RNA-seq analysis
The SRA database sra-format files were converted into fastq format using sratoolkit.2.3.4-2. The Bowtie2 (version 2.1.0, bowtie-bio.sourceforge.net/bowtie2/index.shtml) and tophat2 (tophat.cbcb.umd.edu) programs were applied for sequence alignment. Because this study did not consider the structure of the mRNAs, all sequences were fragmented into 50-bp reads and aligned using tophat or tophat2 with the parameter “–no-coverage-search -G genes.gtf” allowing two mismatches. The tophat program was used only to analyze SOLiD colored space fastq files. Levels of gene expression were evaluated with fragments per kilobase of exon per million reads (FPKM) values calculated using cufflinks (version 2.1.1). A program written in C++ was developed to detect and enumerate SNP alleles in BAM files. The program is open-source software available in a public repository (github.com/takaho/snpexp/).
RNA-seq分析
SRAデータベースsra-形式ファイルはsratoolkit.2.3.4-2を使ってfastq形式に変換されている。 配列アライメントのためにBowtie2(バージョン2.1.0、bowtie-bio.sourceforge.net/bowtie2/index.shtml)とtophat2(tophat.cbcb.umd.edu)プログラムが適用されている。この研究はメッセンジャーRNAの構造を考慮していなかったので、すべての配列は、50 bpの読み取り断片に断片化され、2つのミスマッチを許容する “–no-coverage-search -G genes.gtf”パラメータを指定してトップハットまたはtophat2を使用して整列させた。トップハットプログラムは SOLiD colored space fastq filesを分析するためだけに使用された。遺伝子発現のレベルは、(バージョン2.1.1)のcufflinksを用いて算出されたfragments per kilobase of exon per million reads (FPKM) 値で評価されている。 C ++で書かれたプログラムはBAMファイルの中のSNP対立遺伝子を検出、列挙するために開発されています。プログラムは、公開リポジトリ(github.com/takaho/snpexp/)で入手可能なオープンソースソフトウェアです。
(英文)
SNP identification and heterozygosity tests
Sequence fragments aligned on the mouse genome were analyzed using the SNP detection and enumeration program mentioned above, and only SNPs with cover ratios ≥20 were retained. If ≥95% of the SNP sequence was the same on the two strands, the allele was designated as homozygous.
Genomewide heterozygosity between B6 and 129 was analyzed using a subset of the SNPs described above with different alleles between B6 and 129. SNPs were classified by known expression characteristics (TSC-specific, ESC-specific or other) and genotypes (B6-type homozygous, 129-type homozygous or other). SNP distributions were tested with P-values obtained using Fisher's exact test with Monte-Carlo Markov chain approximation.
SNPの識別およびヘテロ接合性のテスト
マウスゲノム上に整列した配列断片は、SNP検出および上記の計数プログラムを使って分析されている。かつ20以上のカバー率のSNPだけが残されている。 95%以上のSNPシーケンスが二本鎖上で同じだった場合、対立遺伝子はホモ接合と定義される。
B6と129との間の全ゲノムのヘテロ接合は、B6と129 との異なる対立遺伝子による上述したSNPサブセットを使用して分析されている。SNPは既知の発現特性(TS細胞特異的、ES細胞特異的、またはその他)と遺伝子型(B6型ホモ接合、129型ホモ接合またはその他)によって分類されている。SNP分布は、モンテカルロマルコフ連鎖近似に関するフィッシャーの確率検証を用いて得られたP値によって調べられている。
- 2019/05/14(火) 10:20:38|
- 遠藤論文
-
-
| コメント:0
(英文)
Expression analysis by chromosome to identify trisomy
FPKM values originating from ESCs (SRR1171574 and SRR1171575) and STAP cells (SRR1171578 and SRR1171579) were calculated, and genes having >0.01 FPKM in all four original experiments were selected. Genes without pseudogenes were classified for chromosomes, and the log ratio of the average of two experiments using the same cells was determined for each chromosome. The distribution of relative FPKM values was evaluated using one-sided t-test against the mean log ratio of whole genes.
トリソミー識別のための染色体による発現解析
ES細胞(SRR1171574とSRR1171575)及びSTAP細胞(SRR1171578とSRR1171579)由来のFPKM値が算出され、全4回のオリジナルの実験における0.01以上のFPKMを有する遺伝子が選択された。染色体上に偽遺伝子を伴わない遺伝子を分類し、各染色体について同じ細胞を用いた2つの実験の平均の対数比を決定した。相対FPKM値の分布は、全体の遺伝子の平均log比に対して、一群t検定を用いて評価した。
(英文)
MEF marker genes
Marker genes of feeder cells were identified using unpublished RNA-seq data provided by Dr Jafar Sharif and Dr Kyoichi Isono. Gene expression differences among ESCs, TSCs and MEFs were compared using the cuffdiff program, and genes that were significantly highly expressed in MEFs were selected. Genes encoding cytokines and extracellular matrix-related genes were selected to illustrate the features of feeder cells in Fig. 2E.
MEFマーカー遺伝子
フィーダー細胞のマーカー遺伝子はジャファルシャリフ博士や磯野恭一博士によって提供されている未公開のRNA-seqデータを用いて同定されている。 ES細胞、TS細胞及びMEF(マウス胎児線維芽細胞)間の遺伝子発現の違いはcuffdiffプログラムを用いて比較されていて、MEFの中で有意に高頻度で発現された遺伝子が選択されている。サイトカインおよび細胞外マトリックス関連遺伝子をコードする遺伝子が図2Eのフィーダー細胞の特徴を説明するために選ばれている。
(英文)
Acknowledgements
I would like to acknowledge Dr Akihiko Yoshimura, Keio University, who initially suggested on his website that NGS data could be evaluated by SNP analysis. Dr Ichiro Taniuchi and Dr Nyambayar Dashtsoodol, RIKEN-IMS, offered insightful information for interpreting the experimental procedures. Dr Norihito Hayatsu, RIKEN-IMS, provided unpublished inbred/outbred mice sequences to validate the genotype analysis. Dr Jafar Sharif and Dr Kyoichi Isono, RIKEN-IMS, provided unpublished transcriptome data to identify marker genes. Dr Shinichi Nakagawa, RIKEN, provided critical comments on my manuscript, and Mr David Gifford, RIKEN-CSRS, edited the text. I especially thank the authors of the retracted paper, Dr Teruhiko Wakayama, University of Yamanashi and Dr Hitoshi Niwa, RIKEN-CDB, for commenting on this manuscript.
謝辞
私はまず慶應義塾大学の吉村明彦博士に謝辞をささげたい。博士は最初にウェブサイト上でNGSデータがSNP解析により評価しうると示唆された方です。理化学研究所統合生命医科学研究センターの谷内一郎博士とNyambayar Dashtsoodol博士には実験手順を解釈するための洞察力に富んだ情報を提供していただきました。同じく理化学研究所統合生命医科学研究センターの早津徳人博士には遺伝子型解析を検証するために未発表の近親交配系/非近親交配系のマウスシーケンスを提供していただきました。同じく理化学研究所統合生命医科学研究センターのジャファルシャリフ博士と磯野恭一博士にはマーカー遺伝子を特定するために未発表のトランスクリプトームデータを提供していただきました。理研の中川真一博士には私の原稿に重要なコメントを提供していただきました。そして環境資源科学研究センター (CSRS)のデビッド·ギフォード氏はテキストを編集してくれました。また特に取下げ論文の著者である山梨大学の若山照彦博士と理研CDBの丹羽仁博士にはこの原稿について論評していただいたことに感謝致します。
(英文)
References
Ben-David, U., Mayshar, Y. & Benvenisty, N. (2013) Virtual karyotyping of pluripotent stem cells on the basis of their global gene expression profiles. Nat. Protoc. 8, 989–997.
Chang, G., Gao, S., Hou, X. et al. (2014) High-throughput sequencing reveals the disruption of methylation of imprinted gene in induced pluripotent stem cells. Cell Res. 24, 293–306.
DeVeale, B., van der Kooy, D. & Babak, T. (2012) Critical evaluation of imprinted gene expression by RNA-Seq: a new perspective. PLoS Genet. 8, e1002600.
Gropp, A. (1982) Value of an animal model for trisomy. Virchows Arch. A Pathol. Anat. Histol. 395, 117–131.
参照
Ben-David, U., Mayshar, Y. & Benvenisty, N. (2013) 『世界的遺伝子発現プロファイルに基づく多能性幹細胞の仮想核型分類』 Nat. Protoc. 8, 989–997
Chang, G., Gao, S., Hou, X. et al. (2014) 『大量処理シークエンシングが誘導多能性幹細胞の中のインプリンティング遺伝子のメチル化破壊を明らかにする』 Cell Res. 24, 293–306
DeVeale, B., van der Kooy, D. & Babak, T. (2012) 『RNA-配列によるインプリント遺伝子発現の重要な評価:新たな視点』PLoS Genet. 8, e1002600
Gropp, A. (1982) 『トリソミーのための動物モデル』 Virchows Arch. A Pathol. Anat. Histol. 395, 117–131
(英文)
Hussein, S.M., Batada, N.N., Vuoristo, S. et al. (2011) Copy number variation and selection during reprogramming to pluripotency. Nature 471, 58–62.
Kim, Y.M., Lee, J., Xia, L., Mulvihill, J.J. & Li, S. (2013) Trisomy 8: a common finding in mouse embryonic stem (ES) cell lines. Mol. Cytogenet. 6, 3–7.
Lagarrigue, S., Martin, L., Hormozdiari, F., Roux, P.F., Pan, C., van Nas, A., Demeure, O., Cantor, R., Ghazalpour, A., Eskin, E. & Lusis, A.J. (2013) analysis of allele-specific expression in mouse liver by RNA-Seq: a comparison with cis-eQTL identified using genetic linkage. Genetics 195, 1157–1166.
Liu, X., Wu, H., Loring, J., Hormuzdi, S., Disteche, C.M., Bornstein, P. & Jaenisch, R. (1997) Trisomy eight in ES cells is a common potential problem in gene targeting and interferes with germ line transmission. Dev. Dyn. 209, 85–91.
Mayshar, Y., Ben-David, U., Lavon, N., Biancotti, J.C., Yakir, B., Clark, A.T., Plath, K., Lowry, W.E. & Benvenisty, N. (2010) Identification and classification of chromosomal aberrations in human induced pluripotent stem cells. Cell Stem Cell 7, 521–531.
Hussein, S.M., Batada, N.N., Vuoristo, S. et al. (2011) 『多能性再プログラミング中のコピー数の変化と選択』 Nature 471, 58–62
Kim, Y.M., Lee, J., Xia, L., Mulvihill, J.J. & Li, S. (2013) 『トリソミー8:マウス胚性幹(ES)細胞株における一般的所見』 Mol. Cytogenet. 6, 3–7
Lagarrigue, S., Martin, L., Hormozdiari, F., Roux, P.F., Pan, C., van Nas, A., Demeure, O., Cantor, R., Ghazalpour, A., Eskin, E. & Lusis, A.J. (2013) 『RNA-配列によるマウス肝臓における対立遺伝子特異的発現の分析:遺伝子連鎖を使って同定されたcis-eQTLとの比較』 Genetics 195, 1157–1166
Liu, X., Wu, H., Loring, J., Hormuzdi, S., Disteche, C.M., Bornstein, P. & Jaenisch, R. (1997) 『ES細胞におけるトリソミー8は遺伝子ターゲッティングにおける共通の潜在的な問題であり、生殖系列伝達を妨害する』 Dev. Dyn. 209, 85–91
Mayshar, Y., Ben-David, U., Lavon, N., Biancotti, J.C., Yakir, B., Clark, A.T., Plath, K., Lowry, W.E. & Benvenisty, N. (2010) 『人間の人工多能性幹細胞における染色体異常の同定及び分類』 Cell Stem Cell 7, 521–531
(英文)
Obokata, H., Sasai, Y., Niwa, H., Kadota, M., Andrabi, M., Takata, N., Tokoro, M., Terashita, Y., Yonemura, S., Vacanti, C.A. & Wakayama, T. (2014a) Bidirectional developmental potential in reprogrammed cells with acquired pluripotency. Nature 505, 676–680.
Obokata, H., Wakayama, T., Sasai, Y., Kojima, K., Vacanti, M.P., Niwa, H., Yamato, M. & Vacanti, C. (2014b) Stimulus-triggered fate conversion of somatic cells into pluripotency. Nature 505, 641–647.
Tanaka, S., Kunath, T., Hadjantonakis, A.K., Nagy, A. & Rossant, J. (1998) Promotion of trophoblast stem cell proliferation by FGF4. Science 282, 2072–2075.
Wang, L., Wang, S. & Li, W. (2012) RSeQC: quality control of RNA-seq experiments. Bioinformatics 28, 2184–2185.
Obokata, H., Sasai, Y., Niwa, H., Kadota, M., Andrabi, M., Takata, N., Tokoro, M., Terashita, Y., Yonemura, S., Vacanti, C.A. & Wakayama, T. (2014a) 『取得多能性を持つ再プログラム細胞における双方向への発生能力』 Nature 505, 676–680
Obokata, H., Wakayama, T., Sasai, Y., Kojima, K., Vacanti, M.P., Niwa, H., Yamato, M. & Vacanti, C. (2014b) 『体細胞の多能性への刺激惹起性運命変換』 Nature 505, 641–647.
Tanaka, S., Kunath, T., Hadjantonakis, A.K., Nagy, A. & Rossant, J. (1998) 『FGF4による栄養膜幹細胞増殖の促進』 Science 282, 2072–2075
Wang, L., Wang, S. & Li, W. (2012) 『RSeQC:RNA-seq実験の品質管理』 Bioinformatics 28, 2184–2185
(英文)
Supporting Information
(Filename) gtc12178-sup-0001-FigS1.pdf
(Format) application/PDF
(Size) 265K
(Description) Figure S1 Allele distributions from the RNA-seq data obtained for the cell lines reported in the Obokata et al. study. CD45+ cells (gray), ESCs (yellow), STAP cells (blue), STAP-SCs (green), TSCs (orange), EpiSCs (light blue), and FI-SCs (red). The ESCs, STAP cells, STAP-SCs, FI-SCs, and epiblast stem cells (EpiSCs) were annotated as being derived from a 129B6F1 strain, and the TSCs as from a CD1 strain.
サポート情報
(ファイル名) gtc12178-sup-0001-FigS1.pdf
(書式) application/PDF
(サイズ) 265K
(説明) 図S1 小保方らの研究の中で報告された細胞株に対して得られたRNA-seqデータからの対立遺伝子分布。 CD45+細胞(灰色)、ES細胞(黄)、STAP細胞(青)、STAP幹細胞(緑)、TS細胞(オレンジ)、EpiSCs<エピプラスト幹細胞>(水色)、およびFI幹細胞の(赤)。 ES細胞、STAP細胞、STAP幹細胞、FI幹細胞、および胚盤葉上層幹細胞(EpiSCs)は129B6F1株由来のものとして、またTS細胞はCD1株由来のものとして注釈されている。
(英文)
(Filename) gtc12178-sup-0002-FigS2.pdf
(Format) application/PDF
(Size) 214K
(Description) Figure S2 Allele frequencies of all chromosomes. SNPs on all autosomes and the X chromosome were counted, and their distributions are indicated. The RNA-seq data from the CD45+ and STAP cells are identical to those used in Fig. 3. Numbers after each chromosome name are those of applied SNPs of CD45+ rep1, CD45+ rep2, STAP rep1, and STAP rep2, respectively.
(ファイル名) gtc12178-sup-0002-FigS2.pdf
(書式) application/PDF
(サイズ) 214K
(説明) 図S2 すべての染色体の対立遺伝子頻度。すべての常染色体とX染色体上のSNPが計数され、かつそれらの分布が示されている。 CD45+およびSTAP細胞からのRNA-seqデータは図3で使用されているものと同一である。各染色体名の後の数字はそれぞれ、CD45+ rep1、CD45+ rep2、STAP rep1、及びSTAP rep2のSNPの数である。
(英文)
(Filename) gtc12178-sup-0003-TableS1.xlsx
(Format) application/msexcel
(Size) 11K
(Description) Table S1 RNA-seq raw data used in this study
Please note: Wiley Blackwell is not responsible for the content or functionality of any supporting information supplied by the authors. Any queries (other than missing content) should be directed to the corresponding author for the article.
(ファイル名) gtc12178-sup-0003-TableS1.xlsx
(書式) application/msexcel
(サイズ) 11K
(説明) 表S1 本研究で用いたRNA-seqの生データ
ご注意:ワイリーブラックウェルは、著者によって提供されるあらゆる補助情報の内容や機能についての責任を負いません。(コンテンツの欠落を除く)ご質問は記事の責任著者の方へお願いします。
- 2020/01/27(月) 11:39:31|
- 遠藤論文
-
-
| コメント:0