(英文)
Contamination in FI-SC samples
Examination of allele frequencies in RNA-seq fragments enables detection of specific characteristics of the sampled cells. When a set of genes specifically expressed in a particular cell type shows a distinct genotype, the origins of the cells can be assumed. This analysis of SNPs in mRNA sequence reads from the Obokata et al. study showed that the origins of the STAP and FI-SC samples were likely different than originally reported. The simulation showed that the mode of the distribution depends both on the cellular composition of the sample and possible variance caused by PCR bias. When we ignore the PCR bias of binomial distribution, the ratio of contaminating cells can be roughly estimated by the peak position in the distribution.
FI幹細胞サンプルの汚染
RNA-seq断片の対立遺伝子頻度の検討はサンプリングされた細胞の特性検出を可能にする。特定の細胞型において特殊に発現される一組の遺伝子が異なる遺伝子型を示す場合、その細胞の起源を想定することができる。メッセンジャーRNA配列におけるSNPに関するこの分析は、提示された小保方らの研究から、STAPとFI幹細胞サンプルの起源が最初に報告されたよりも異なっているらしいことを読み取る。シミュレーションは分布の様態がサンプルの細胞組成とPCRバイアスに起因する分散の両方に依存することを示している。二項分布のPCRバイアスを無視すると、我々は混入細胞の割合を大雑把に分布のピーク位置によって推定することができる。
(英文)
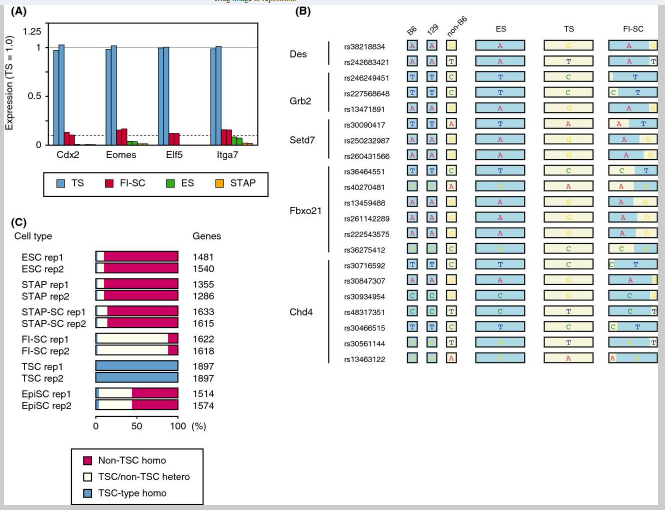
The most likely cell type to be contaminating the FI-SCs in the original study, TSCs, had many more heterozygous (B6/non-B6) alleles than non-B6 homozygous alleles. SNPs of FI-SCs were counted in alleles where B6 and 129 have different nucleotides and duplicated experiments resulted in 6859 and 7243 heterozygous SNPs and 24 and 14 non-B6 homozygous alleles, respectively. The percentage of contaminating cells can be assumed with genotype observation because the peak allele frequencies were at approximately 95–96%, whereas the population peak is expected to be at approximately 10%. This result was concordant with the expression of TSC marker genes. All of the examined TSC marker genes examined were expressed in approximately 10% of TSCs (Fig. 4A).

最初の研究でFI肝細胞を汚染する最も可能性の高い細胞型であるTS細胞は、非B6同型接合対立遺伝子よりももっと多くのヘテロ接合(B6/非B6)対立遺伝子を有していた。 FI幹細胞のSNPは、B6および129が異なるヌクレオチドを有し、かつそれぞれ、6859と7243のヘテロ接合SNPおよび24と14の非B6ホモ接合性対立遺伝子に結果された重複実験をされた対立遺伝子の中で数えられた。混入細胞の割合は遺伝子型観察によって推定することができる。なぜなら総数のピークが約10%であることが期待されているのに対して、ピークの対立遺伝子頻度が約95から96パーセントであったためである。この結果はTS細胞のマーカー遺伝子の発現と一致している。調べられたTS細胞のマーカー遺伝子の全てが約10%のTS細胞(図4A)の中で発現している。
(Fig. 4のリジェンド)
Figure 4. Examination of incorporated mRNAs in FI-SCs. (A) Expression of TSC marker genes in ESCs, TSCs, and FI-SCs. The solid line indicates the average TSC gene expression and dashed line indicates 10% of the average. (B) Heterozygous SNPs detected in Des, Grb2, Setd7, Fbxo21, and Chd4 where B6 and 129 share the same SNPs but TSCs did not. (C) Gene-wise analysis of distribution of heterozygous/homozygous SNPs having TSC-specific alleles.
[図4] FI幹細胞に組み込まれたメッセンジャーRNAの検討。 (A)ES細胞、TS細胞及びFI幹細胞の中のTS細胞マーカー遺伝子の発現。実線は平均のTS細胞遺伝子発現を示し、破線は平均の10%を示している。 (B)B6と129が同じSNPを共有し、TS細胞はそうでない場合にDes、Grb2、Setd7、Fbxo21、およびChd4で検出されたヘテロ接合SNP。(C)TS細胞独自の対立遺伝子を有するヘテロ接合/ホモ接合のSNP分布のジーンワイズ分析。
(本文続き)
FI-SC-specific SNPs were also examined where B6- and 129-derived sequences shared the same nucleotide but FI-SC-derived ones did not. Most of these SNPs matched with the CD1 background of the TSCs used in the experiment and were different from B6 or 129. Gene-by-gene representation (Fig. 4B) and whole-SNP analysis (Fig. 4C) showed that FI-SCs shared TSC-specific SNPs. As the proportion of contaminating TSCs in the FI-SCs was minor, most of the TSC-specific SNPs appeared heterozygous. These results support the view that the RNA-seq data contained transcripts from two major cell populations, with approximately 90% B6 cells having an ESC-like expression pattern and approximately 10% CD1-like cells having a TSC-like pattern. Therefore, the claim in the Obokata et al. paper that FI-SCs contribute to the placenta might have been based in error on contamination by TSCs, which are known to be organ stem cells (Tanaka et al. 1998).
B6と129由来の配列が同じヌクレオチドを持ち、かつFI幹細胞由来のものはそうでない場合のFI幹細胞独自のSNPが検討された。これらのSNPの大部分は実験で使われたTS細胞のCD1バックグラウンドと一致し、かつB6または129とは異なっていた、対応遺伝子ごとの表示(図4B)及び全SNP分析(図4C)はFI幹細胞がTS細胞独自のSNPを共有していることを示している。FI幹細胞の中に混入したTS細胞の割合が軽微だったので、TS細胞独自のSNPのほとんどがヘテロ接合として現れた。これらの結果は、RNA-seqデータが、ES細胞のような発現パターンを持つ約90%のB6細胞と、TS細胞のようなパターンを有する約10%のCD1のような細胞の、二つの主要な細胞集団からの転写物を含んでいるという見解を支持する。したがって、FI幹細胞が胎盤に貢献するという小保方ら論文の主張は臓器幹細胞であることが知られている(Tanaka et al. 1998)TS細胞の混入による間違いを根拠にしているかも知れない。
(英文)
Interpretation of the STAP phenomenon
Detection of aneuploidy using SNPs also suggested contamination in the original experiments. Both genotype and phenotype analyses suggested that the STAP cells used in the Obokata et al. experiments had trisomy of chromosome 8, and a transcription assay indicated atypical expression of genes on chromosome 13. Trisomy 8 is the most common chromosomal abnormality in mice, and chromosome 8 has been reported to fuse to the end of chromosome 13 (Kim et al. 2013). These observations might explain the results of virtual karyotyping in Fig. 3B. The RNA-seq data used in Fig. 3 were annotated as being derived from neonatal mouse spleen cells cultured in conditions under which the STAP cells did not grow. This description does not agree with the dominance of cells having trisomy because mice carrying pure trisomy 8 are embryonic lethal. This therefore leads to the conclusion that the cells were cultured cells that possessed expression characteristics that were very similar to those of ESCs.
STAP現象の解釈
SNPを使った異数性検出はまた元の実験に汚染のあることを示唆している。遺伝子型と表現型の両方の解析はObokataらの実験で使用されたSTAP細胞が8番染色体にトリソミーを有することを暗示し、転写因子検査は13番染色体上に遺伝子の異型の発現があることを示している。トリソミー8はマウスにおいて最も一般的な染色体異常であり、第8番染色体は13番染色体の末端に融合することが報告されている (Kim et al. 2013)。これらの観察は図3(b)の仮想染色体分析の結果を説明しているかもしれない。図3で使用されたRNA-seqデータは、STAP細胞が増殖しなかった条件下で培養された、新生児マウス脾臓細胞に由来するとして注釈されている。純粋なトリソミー8を有するマウスは胎生致死であるため、この記述は、トリソミーを有する細胞の優位性とは一致しない。したがって、これは、細胞がES細胞のものと非常に類似した発現特性を保有する培養細胞であったという結論に導く。
(英文)
Conclusion
The SNP allele frequency method described here is limited by the fact that if the contaminating and examined cells share a common genetic background, the allele frequencies will not be different enough to detect the contamination. However, this method is, in principle, applicable to any RNA-seq data that contain polymorphisms and will be useful for both prospective and retrospective quality control of RNA-seq experiments, especially for studies using cultured cells such as ESCs and iPS cells and their derivatives.
結論
ここで記述されたSNP対立遺伝子頻度法は汚染検査されている細胞が共通の遺伝的背景を共有している際には、対立遺伝子頻度が汚染を検出するのに十分なだけ異ならないかもしれないという事実によって制約されている。しかし、この方法は、原理的には、多型を含むどのRNA-seqのデータにも適用可能であり、また前向きであれ遡及的であれ両方の品質管理のために、特にES細胞やiPS細胞及びそれらの派生細胞などの培養細胞を用いた研究にとって、有用であろう。
(英文)
Experimental procedures
Dataset
Mouse variation data were obtained from the Sanger Mouse Genomes Project (*ttp://www.sanger.ac.uk/resources/mouse/genomes/), and the version 137 VCF-formatted dataset was retrieved from dbSNP (*ttp://www.ncbi.nlm.nih.gov/SNP/).
The locations of genes and included exons were obtained from iGenomes (*ttp://support.illumina.com/sequencing/sequencing_software/igenome.ilmn). SNPs outside exons were excluded from the original VCF file using this annotation, and thus, 1 016 227 SNPs were used for the entire dataset.
<実験手順>
データセット
マウスバリエーションデータはサンガーマウスゲノムプロジェクト (*ttp://www.sanger.ac.uk/resources/mouse/genomes/)から入手された。またバージョン137 VCF-フォーマットデータセットはdbSNP (*ttp://www.ncbi.nlm.nih.gov/SNP/)から検索された。
遺伝子および含まれているエキソンの位置はiGenomes(*ttp://support.illumina.com/sequencing/sequencing_software/igenome.ilmn)から入手された。 エキソンの外側にあるSNPはこのiGenomesの注釈を使用して元のVCFファイルから除外されている。従って1016227のSNPはデータセット全体のために使用されている。
(英文)
Raw sequencing data from the original RNA-seq experiments examined in this study were downloaded from the short read archive (SRA) at NCBI. The accession number of the project is SRP038104. Genome sequences of mouse (version 38, mm10) obtained from B6 mouse strain were downloaded from NCBI GenBank and encoded into a bowtie database using the bowtie-build (for colored space fastq files) or bowtie2-build (for fastq files) program. The accession numbers (i.e., SRA ID) of the RNA-seq experiments are listed in Table S1 (Supporting Information), and the checksums of archived sequences were confirmed by Dr Teruhiko Wakayama, Yamanashi University, one of the corresponding authors of the original paper.
この研究で調べられた元のRNA-seq実験からの生シーケンシングデータは、NCBIのショートリードアーカイブ(SRA)からダウンロードされた。 プロジェクトの受託番号はSRP038104である。 B6マウス株から得られたマウスのゲノム配列(バージョン38、mm10)をNCBI GenBankからダウンロードし、bowtie-build(着色スペースfastqファイル用)またはbowtie2-build(fastqファイル用)プログラムを使用してbowtieデータベースにコード化した。 RNA-seq実験の受託番号(すなわち、SRA ID)は表S1(支援情報)に列挙され、アーカイブされた配列のチェックサムは原著論文の責任著者の一人である山梨大学若山照彦博士によって確認されている。
(英文)
RNA-seq analysis
The SRA database sra-format files were converted into fastq format using sratoolkit.2.3.4-2. The Bowtie2 (version 2.1.0, bowtie-bio.sourceforge.net/bowtie2/index.shtml) and tophat2 (tophat.cbcb.umd.edu) programs were applied for sequence alignment. Because this study did not consider the structure of the mRNAs, all sequences were fragmented into 50-bp reads and aligned using tophat or tophat2 with the parameter “–no-coverage-search -G genes.gtf” allowing two mismatches. The tophat program was used only to analyze SOLiD colored space fastq files. Levels of gene expression were evaluated with fragments per kilobase of exon per million reads (FPKM) values calculated using cufflinks (version 2.1.1). A program written in C++ was developed to detect and enumerate SNP alleles in BAM files. The program is open-source software available in a public repository (github.com/takaho/snpexp/).
RNA-seq分析
SRAデータベースsra-形式ファイルはsratoolkit.2.3.4-2を使ってfastq形式に変換されている。 配列アライメントのためにBowtie2(バージョン2.1.0、bowtie-bio.sourceforge.net/bowtie2/index.shtml)とtophat2(tophat.cbcb.umd.edu)プログラムが適用されている。この研究はメッセンジャーRNAの構造を考慮していなかったので、すべての配列は、50 bpの読み取り断片に断片化され、2つのミスマッチを許容する “–no-coverage-search -G genes.gtf”パラメータを指定してトップハットまたはtophat2を使用して整列させた。トップハットプログラムは SOLiD colored space fastq filesを分析するためだけに使用された。遺伝子発現のレベルは、(バージョン2.1.1)のcufflinksを用いて算出されたfragments per kilobase of exon per million reads (FPKM) 値で評価されている。 C ++で書かれたプログラムはBAMファイルの中のSNP対立遺伝子を検出、列挙するために開発されています。プログラムは、公開リポジトリ(github.com/takaho/snpexp/)で入手可能なオープンソースソフトウェアです。
(英文)
SNP identification and heterozygosity tests
Sequence fragments aligned on the mouse genome were analyzed using the SNP detection and enumeration program mentioned above, and only SNPs with cover ratios ≥20 were retained. If ≥95% of the SNP sequence was the same on the two strands, the allele was designated as homozygous.
Genomewide heterozygosity between B6 and 129 was analyzed using a subset of the SNPs described above with different alleles between B6 and 129. SNPs were classified by known expression characteristics (TSC-specific, ESC-specific or other) and genotypes (B6-type homozygous, 129-type homozygous or other). SNP distributions were tested with P-values obtained using Fisher's exact test with Monte-Carlo Markov chain approximation.
SNPの識別およびヘテロ接合性のテスト
マウスゲノム上に整列した配列断片は、SNP検出および上記の計数プログラムを使って分析されている。かつ20以上のカバー率のSNPだけが残されている。 95%以上のSNPシーケンスが二本鎖上で同じだった場合、対立遺伝子はホモ接合と定義される。
B6と129との間の全ゲノムのヘテロ接合は、B6と129 との異なる対立遺伝子による上述したSNPサブセットを使用して分析されている。SNPは既知の発現特性(TS細胞特異的、ES細胞特異的、またはその他)と遺伝子型(B6型ホモ接合、129型ホモ接合またはその他)によって分類されている。SNP分布は、モンテカルロマルコフ連鎖近似に関するフィッシャーの確率検証を用いて得られたP値によって調べられている。
- 2019/05/14(火) 10:20:38|
- 遠藤論文
-
-
| コメント:0


